Screenshots
All shots are from live clusters — mostly a local Kind cluster brought up with ./scripts/setup.sh + ./scripts/bootstrap-ai.sh, plus a few from the AWS EKS path. No mock-ups.
Some tabs show live data from third-party integrations (SonarCloud, Datadog, PagerDuty, …) that will be empty on a fresh install until you add your own credentials — see Optional third-party integrations.
The portal
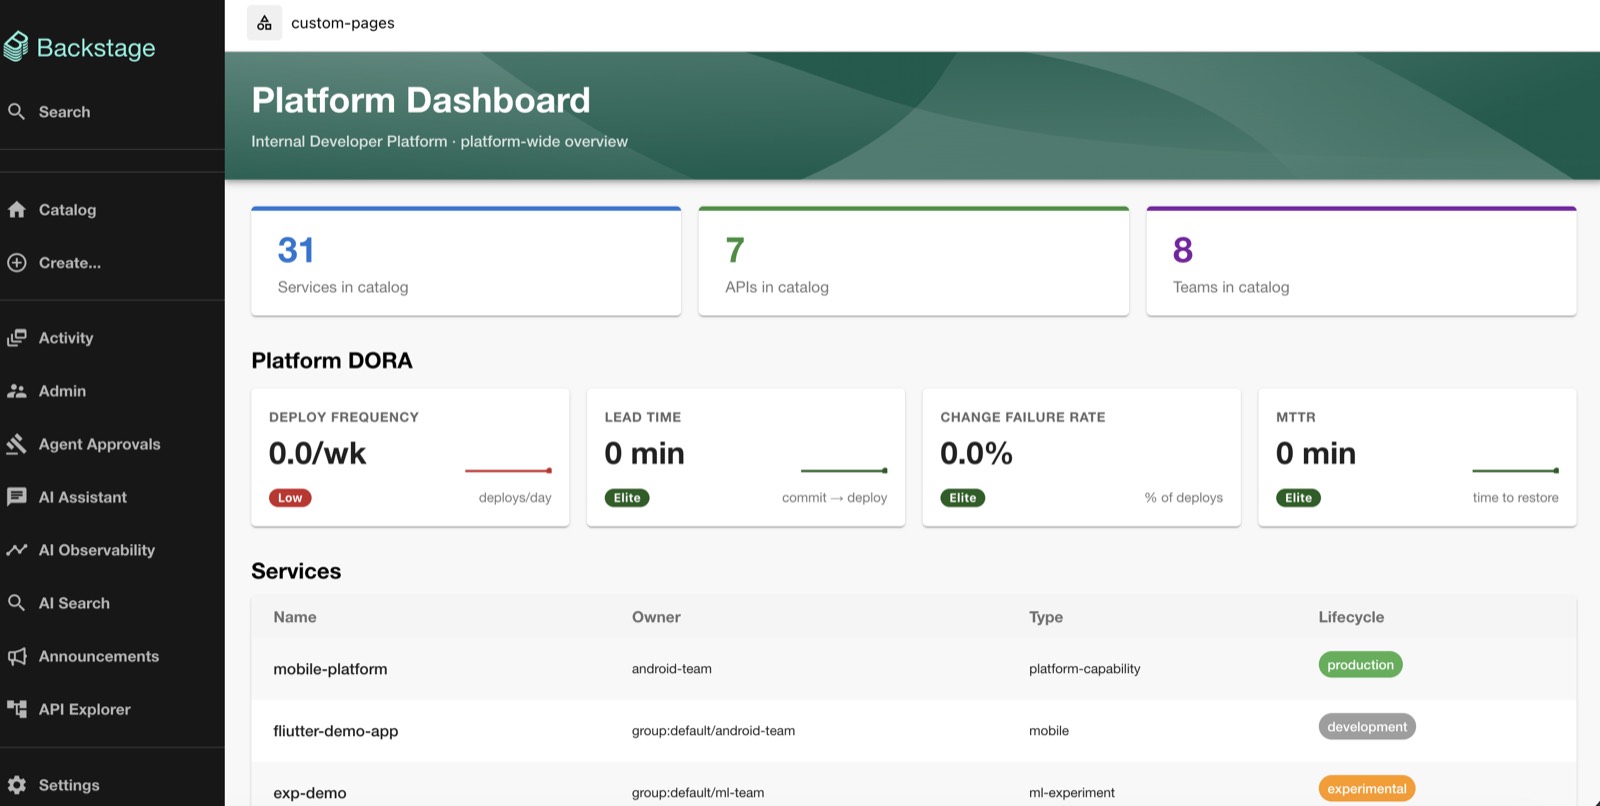
The Platform Dashboard is the landing page: catalog counts, platform-wide DORA, and every service at a glance.
| Software Catalog | Teams |
|---|---|
 |
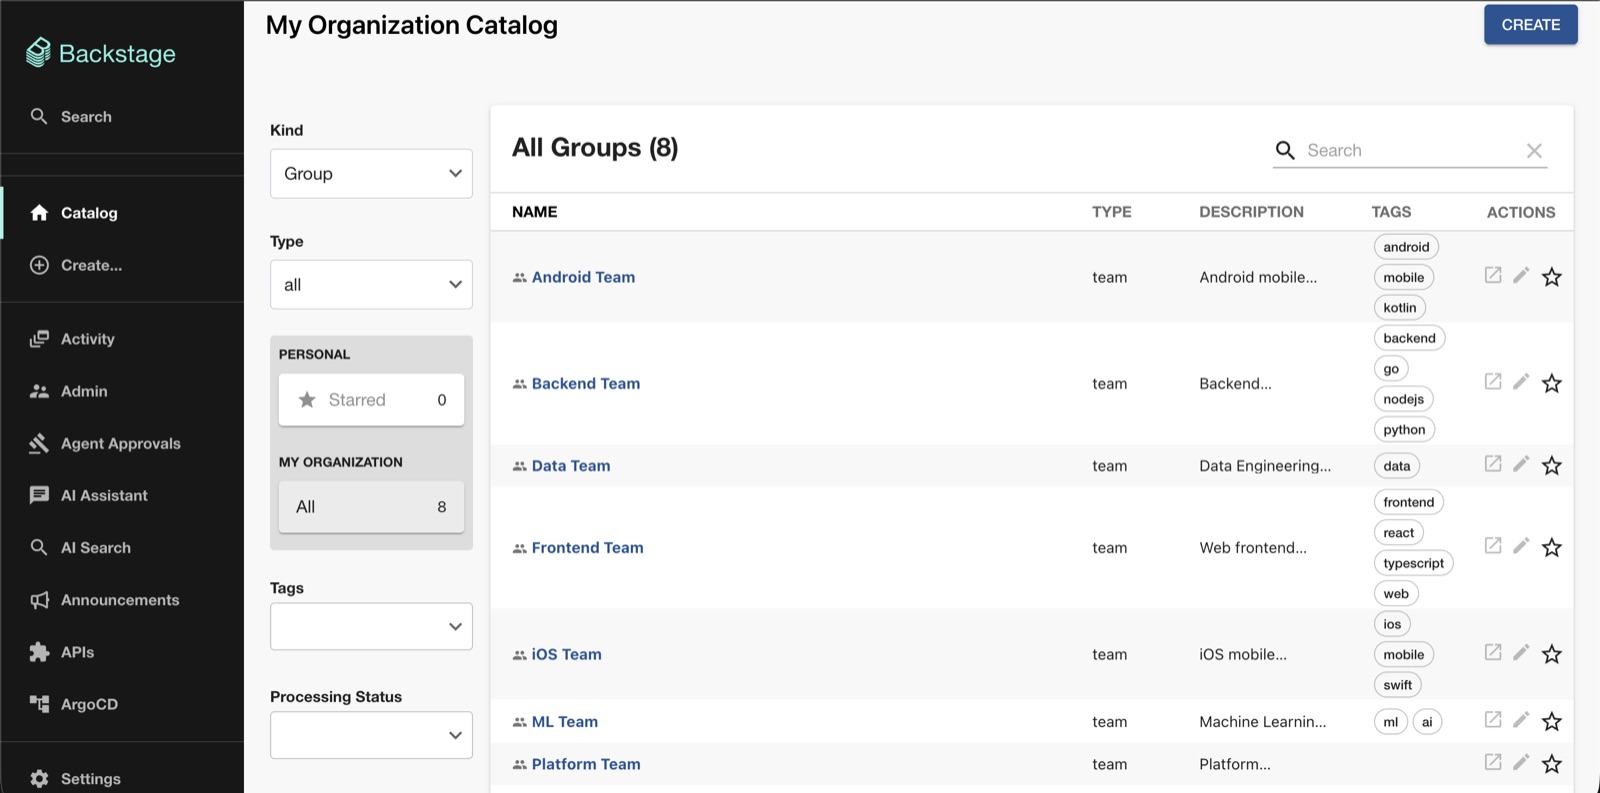 |
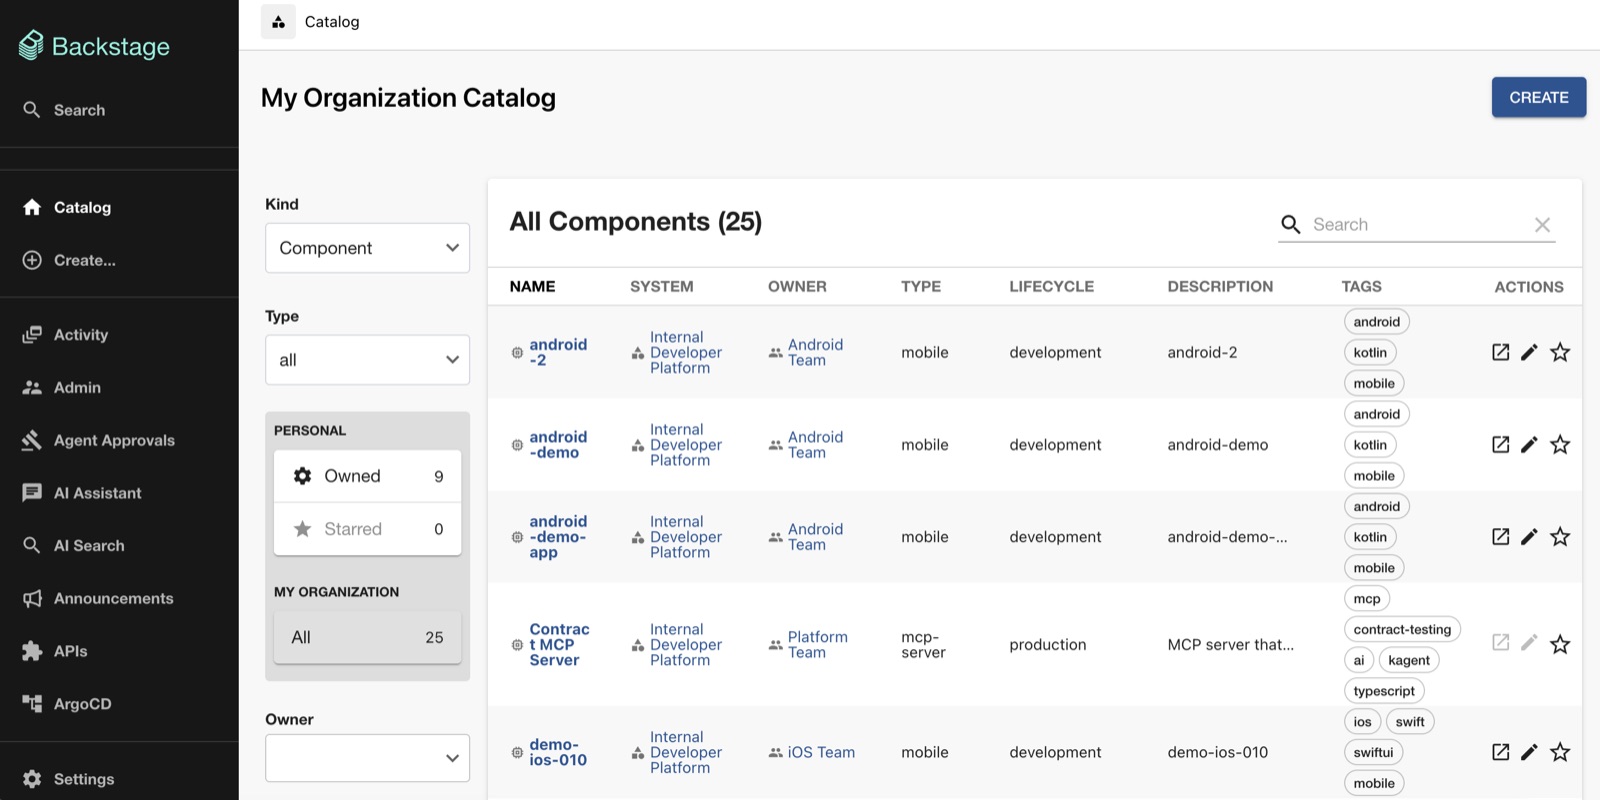
| Every service, API, MCP server and test suite, owned and tagged | 8 teams, each with its own namespace, SecretStore and Grafana folder |
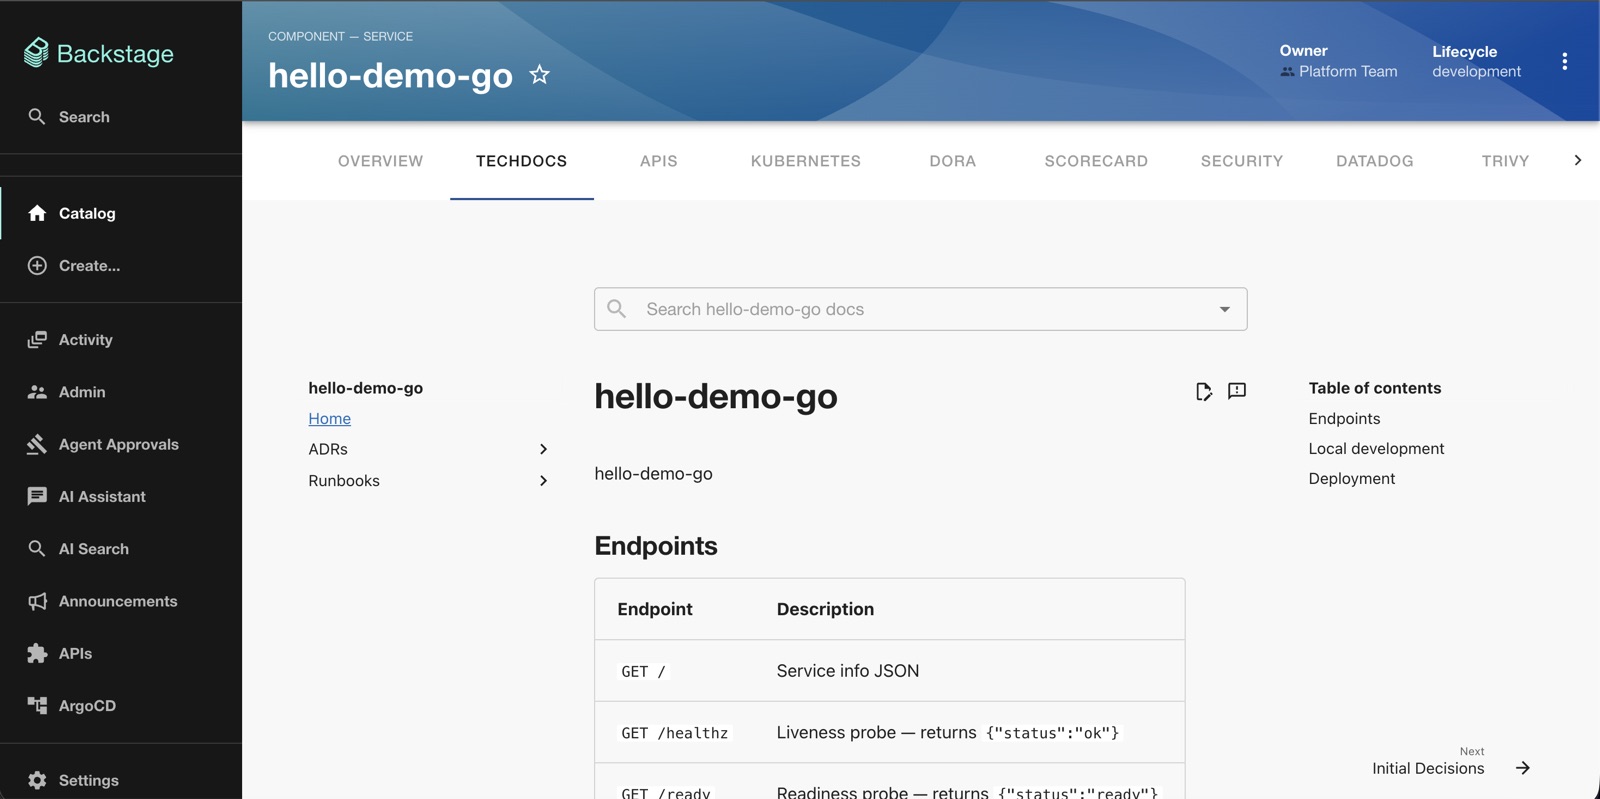
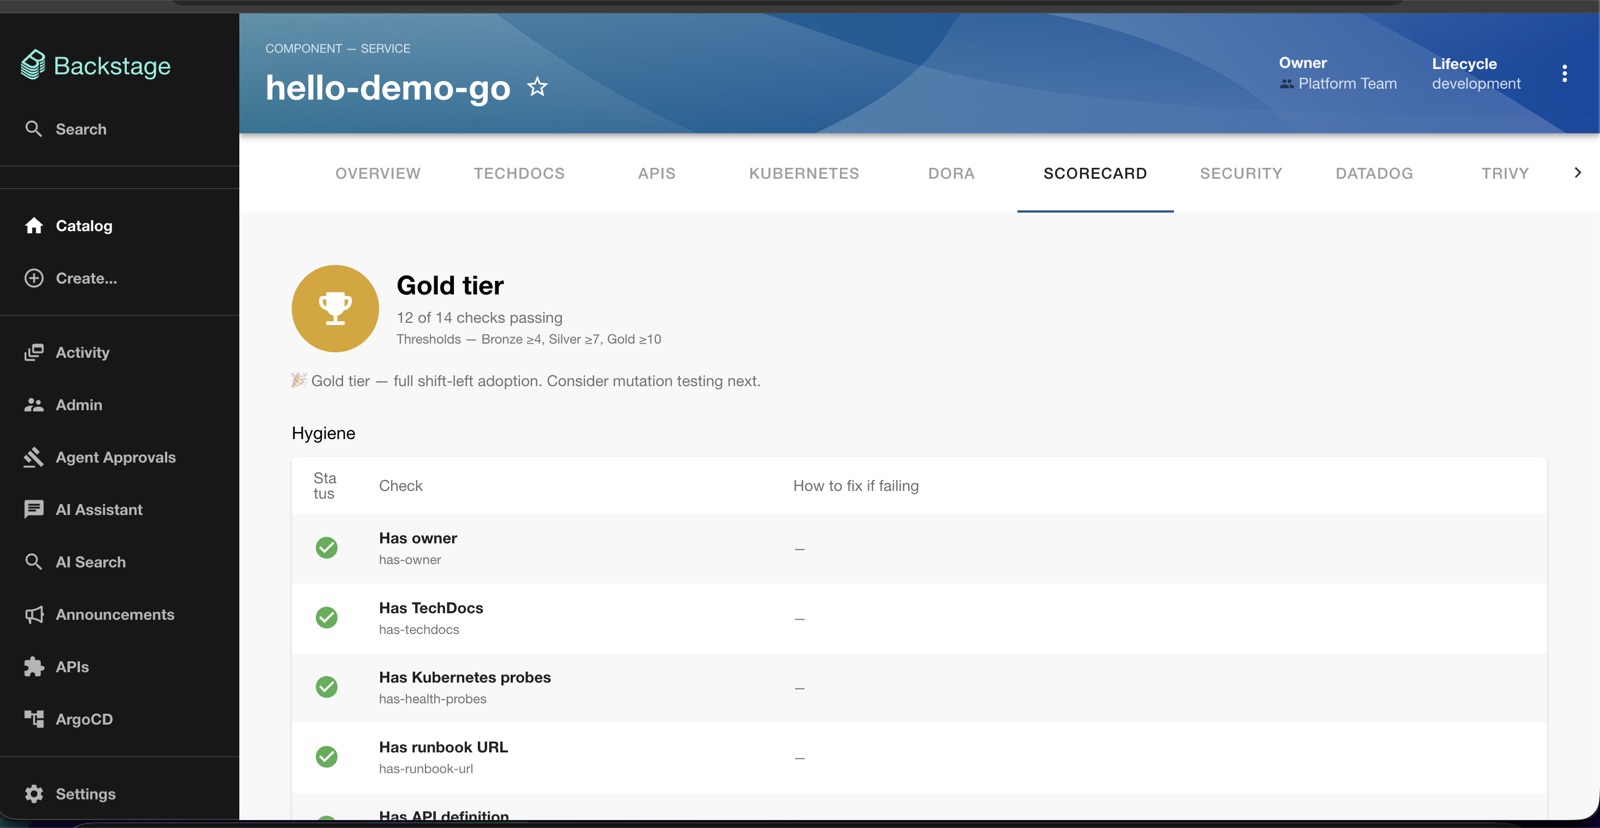
Each entity page carries the platform's own tabs — TechDocs, Kubernetes, DORA, Scorecard, Security, Datadog, Trivy, SLOs:
| TechDocs on the entity | Scorecard on the entity |
|---|---|
 |
 |
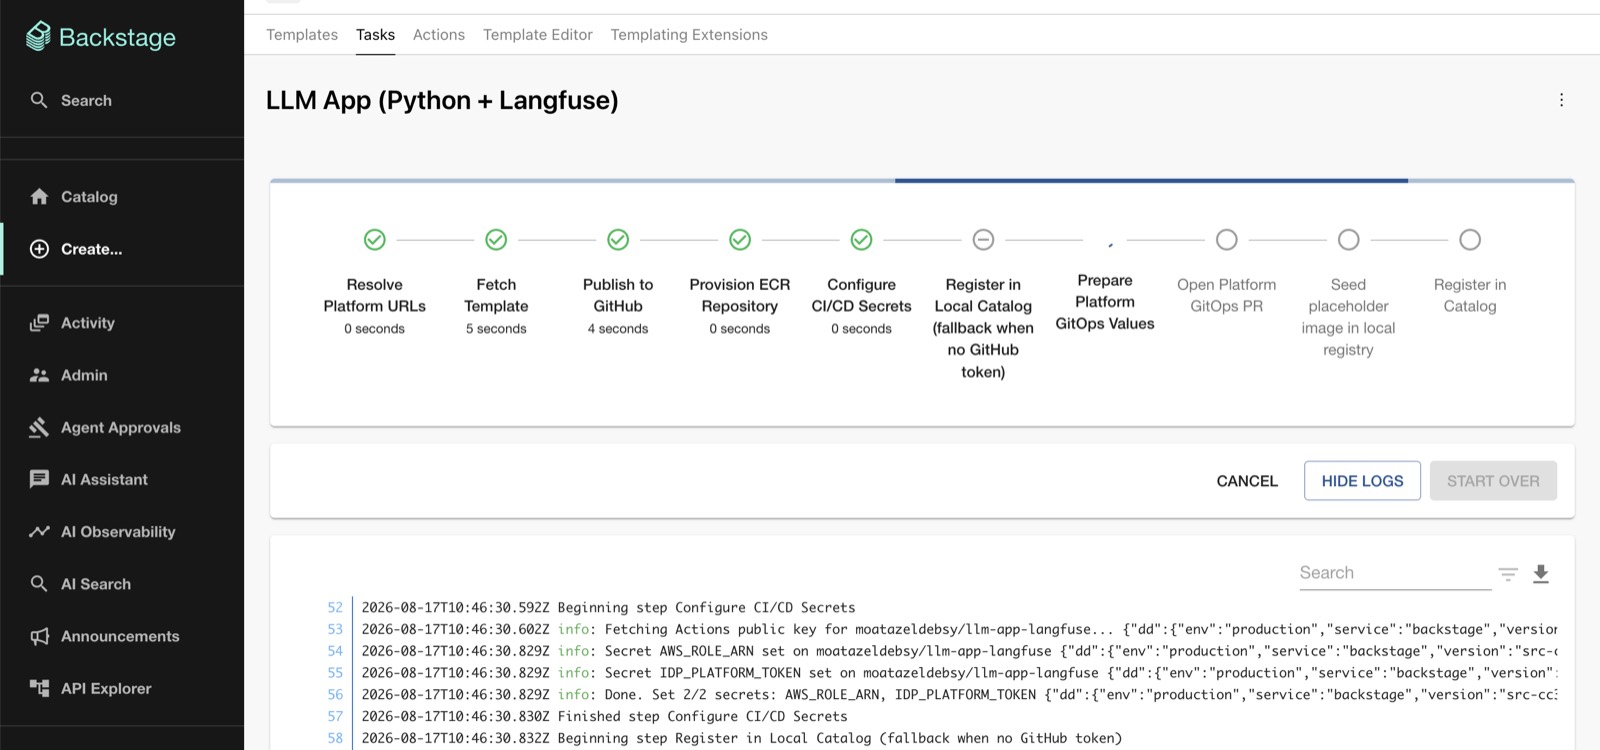
Golden path — scaffold → repo → deploy
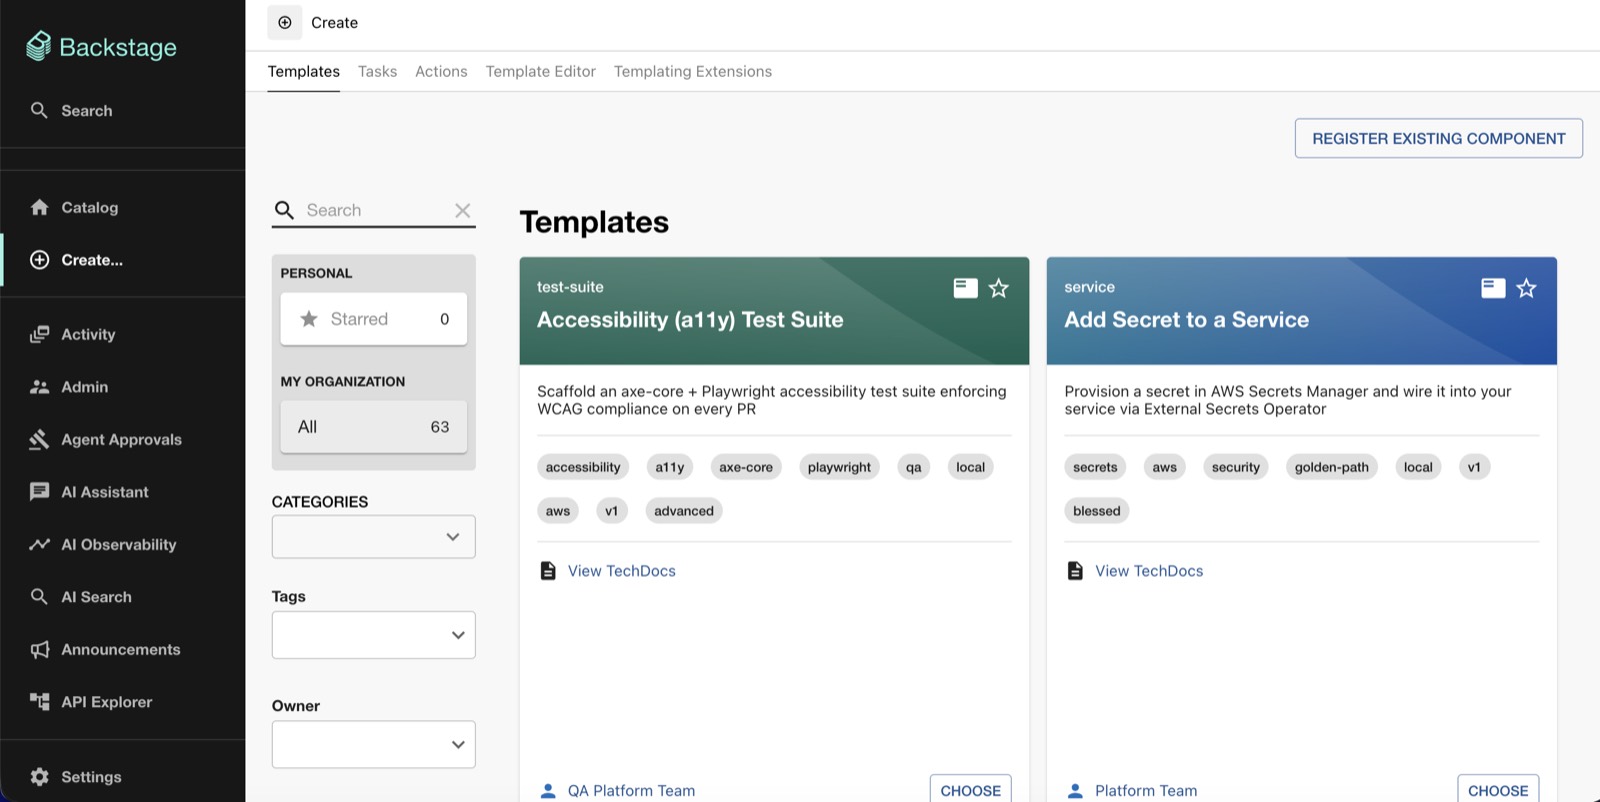
59 templates in the Scaffolder, filtered by category, tag or owner:
| Scaffolder task running | The repo it produced |
|---|---|
 |
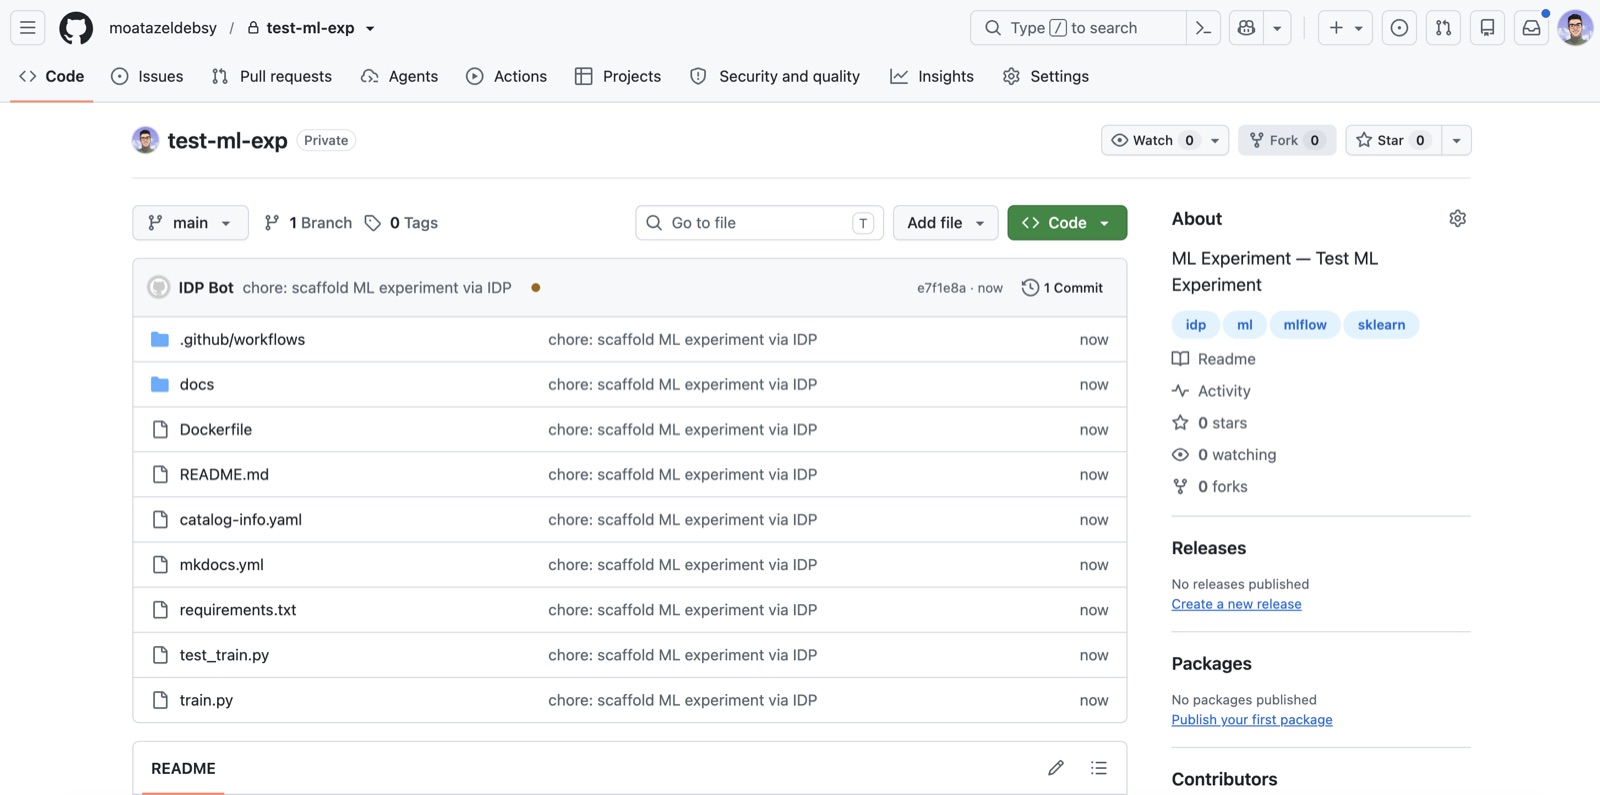 |
| Generate → push to GitHub → register in catalog → run the first job | CI workflow, Dockerfile, catalog-info.yaml, TechDocs — all wired |
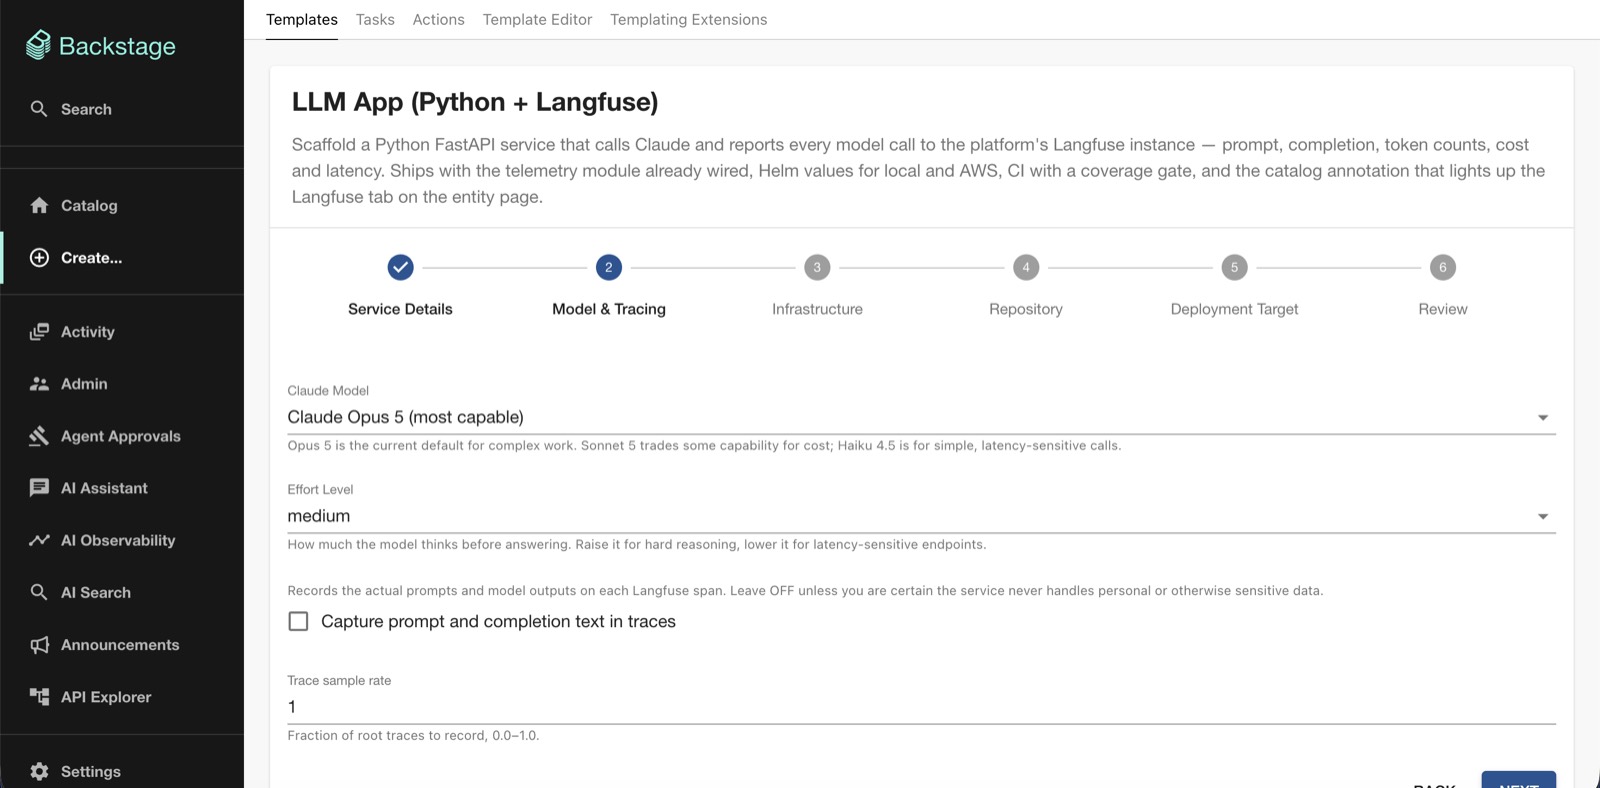
Templates are wizards, not a wall of fields — and the last step opens the GitOps PR that puts the new service under ArgoCD:
| Template wizard (LLM App) | The GitOps PR it opened |
|---|---|
 |
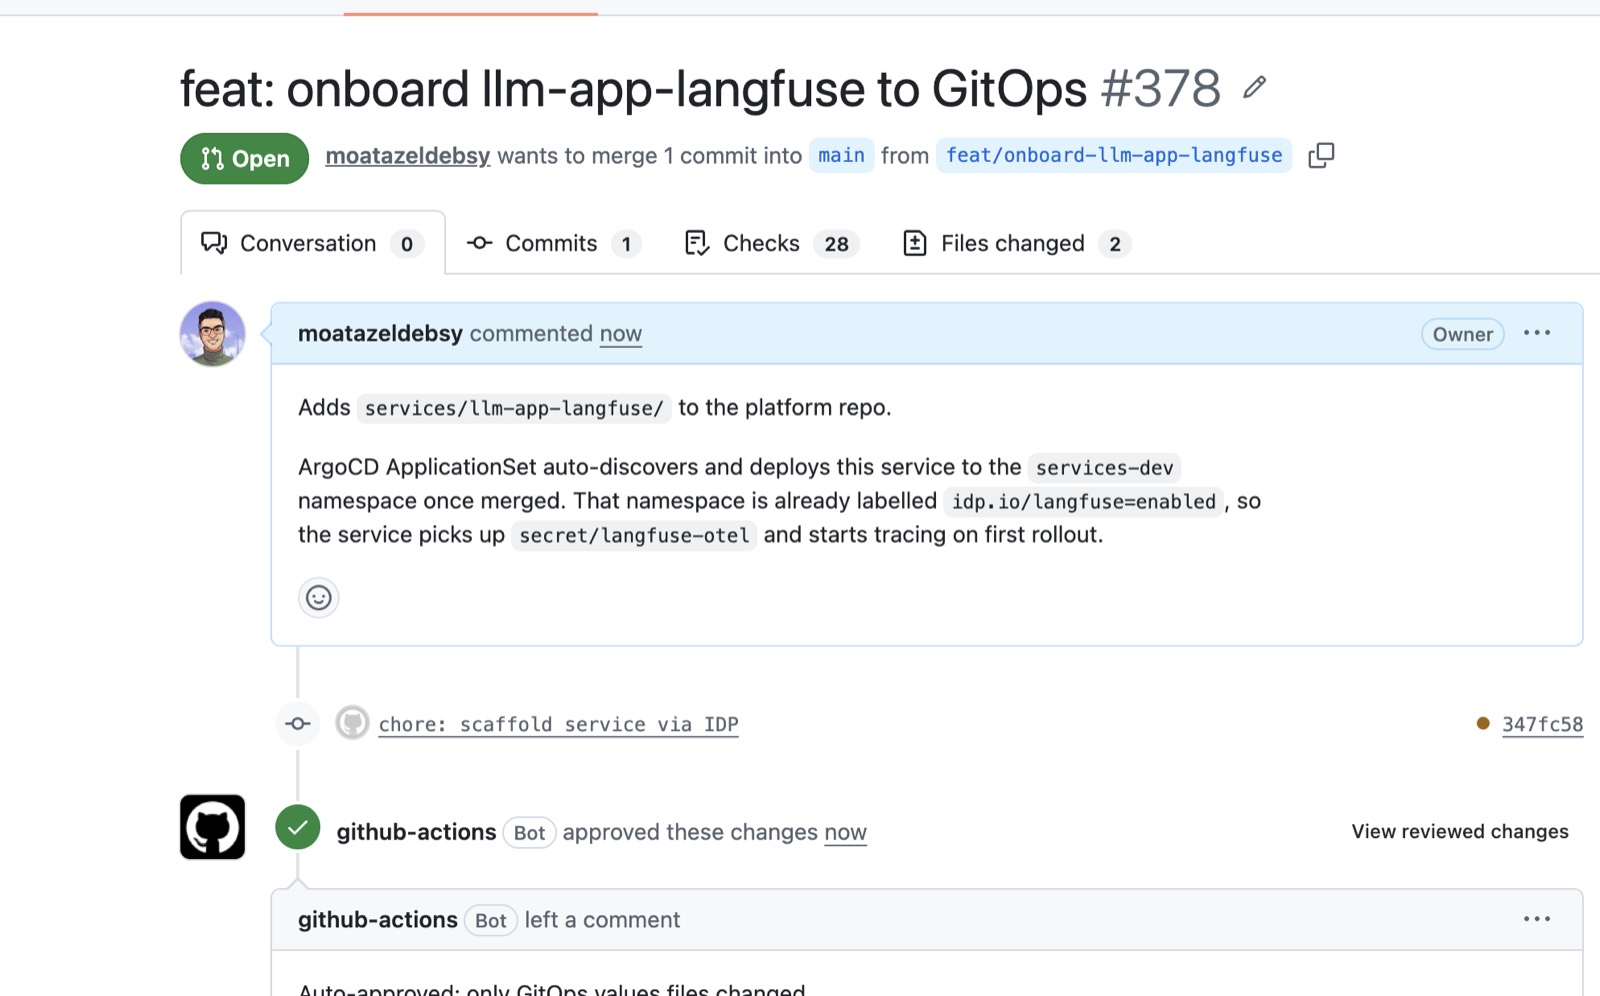 |
| Model, effort level, trace sampling — chosen up front, wired into the skeleton | An ApplicationSet auto-discovers the service into services-dev on merge |
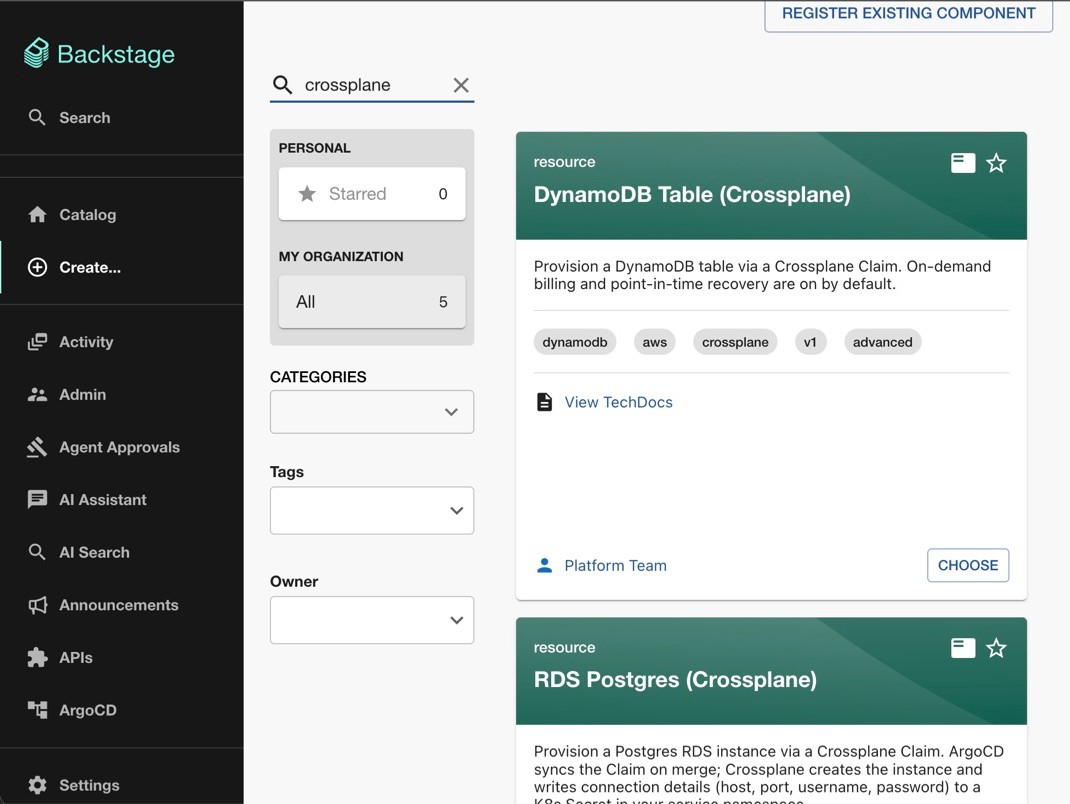
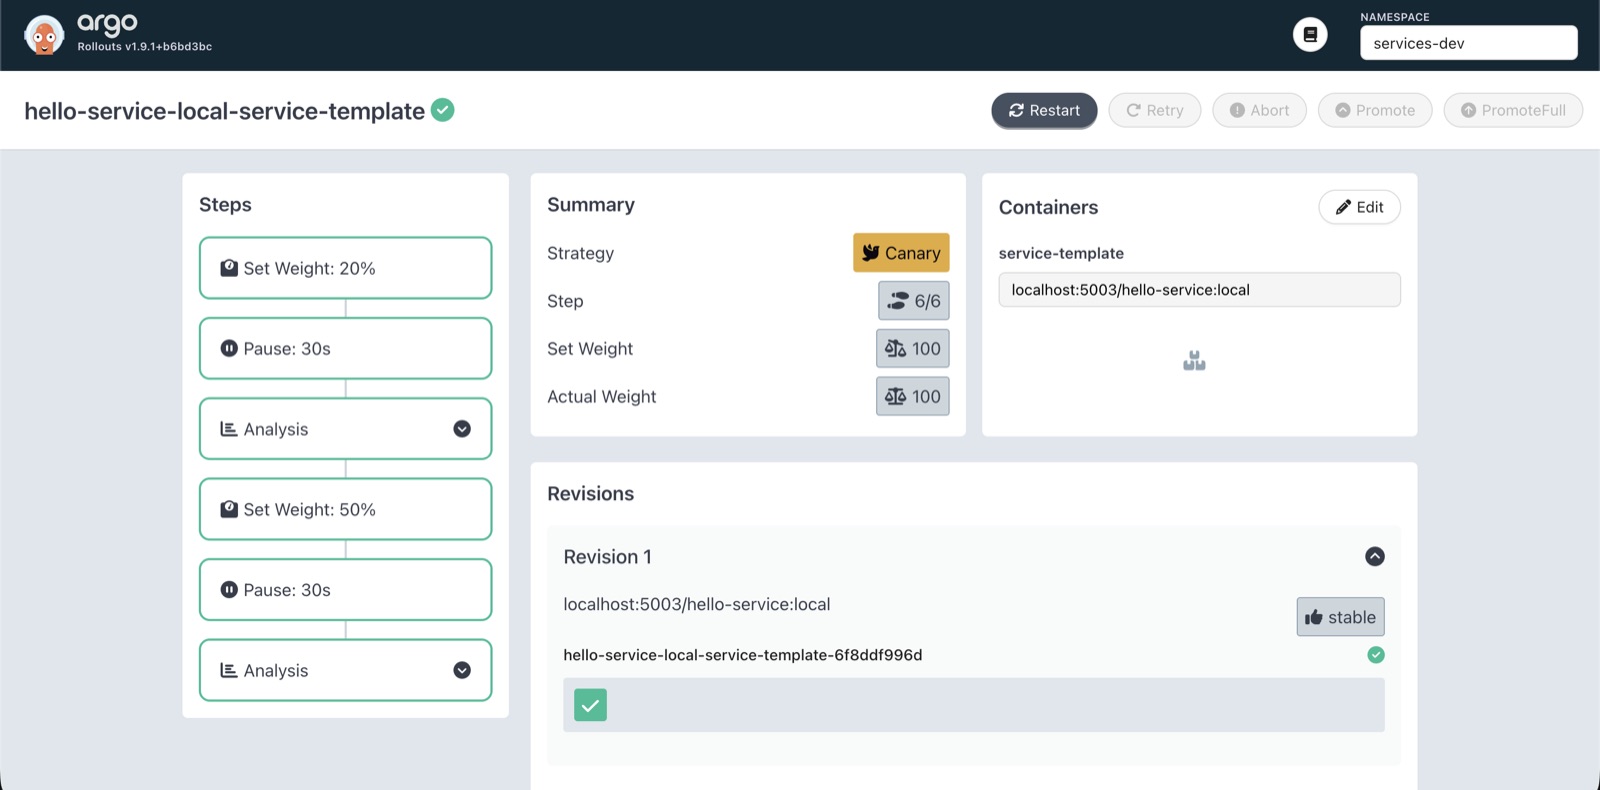
Self-service infrastructure is the same flow — a Crossplane Claim committed to Git instead of a Terraform PR:
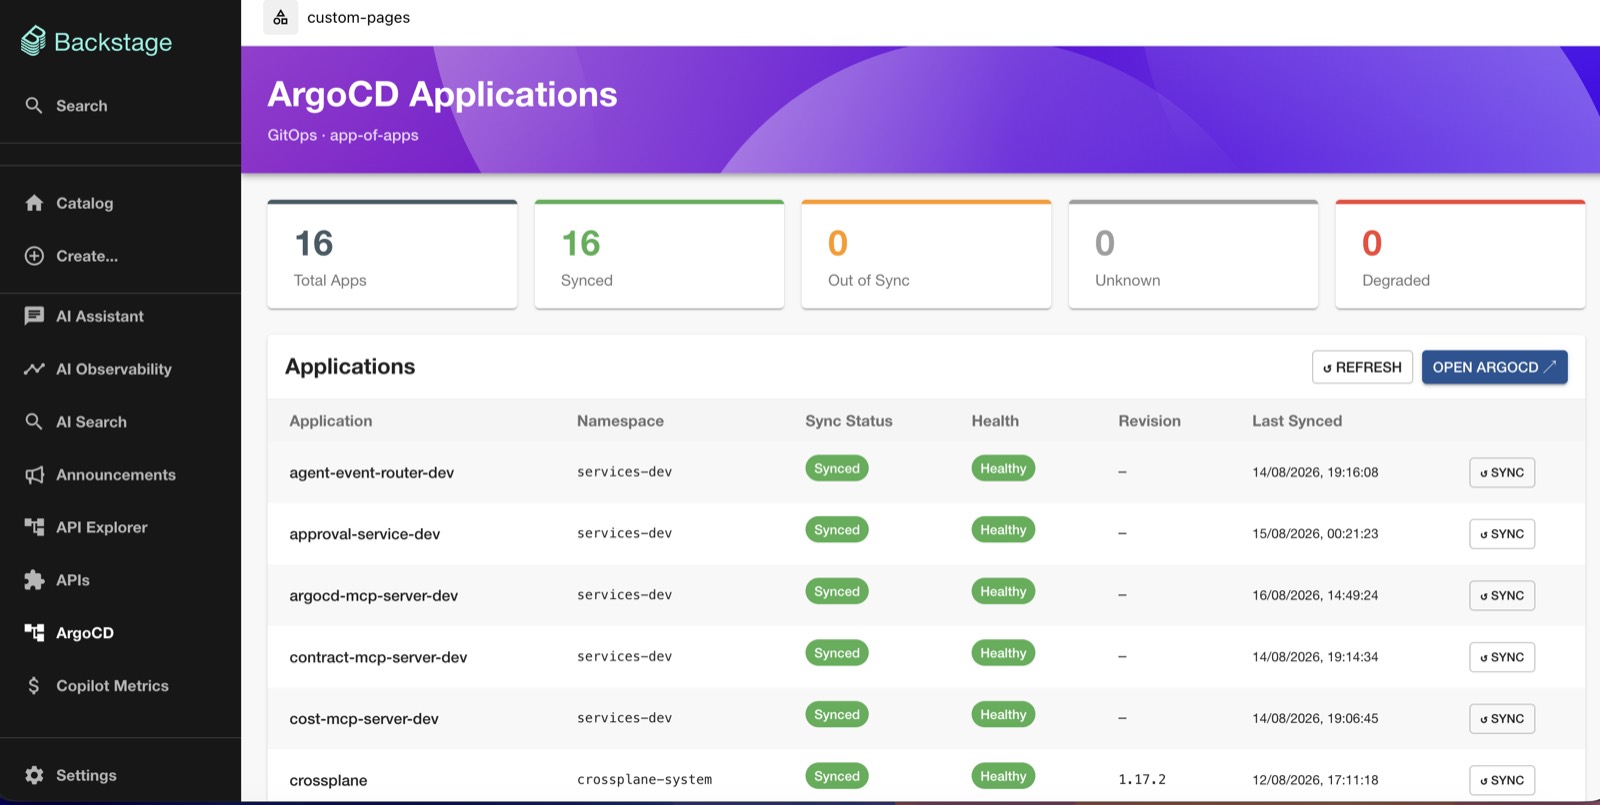
| ArgoCD app-of-apps | Argo Rollouts canary |
|---|---|
 |
 |
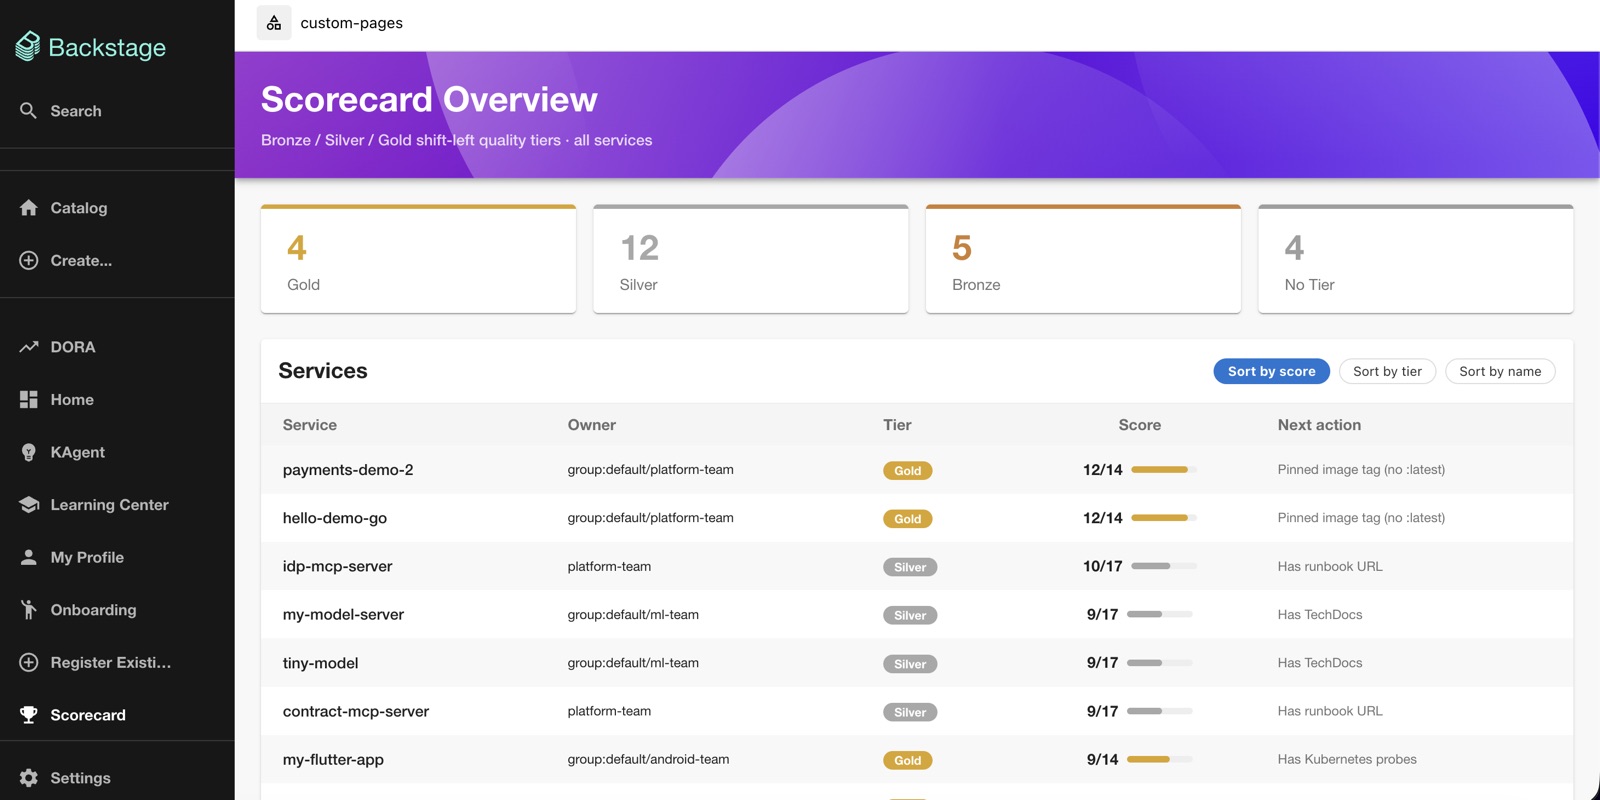
Shift-left quality
Bronze / Silver / Gold tiers across every service, with the cheapest unfilled check called out as the next action:
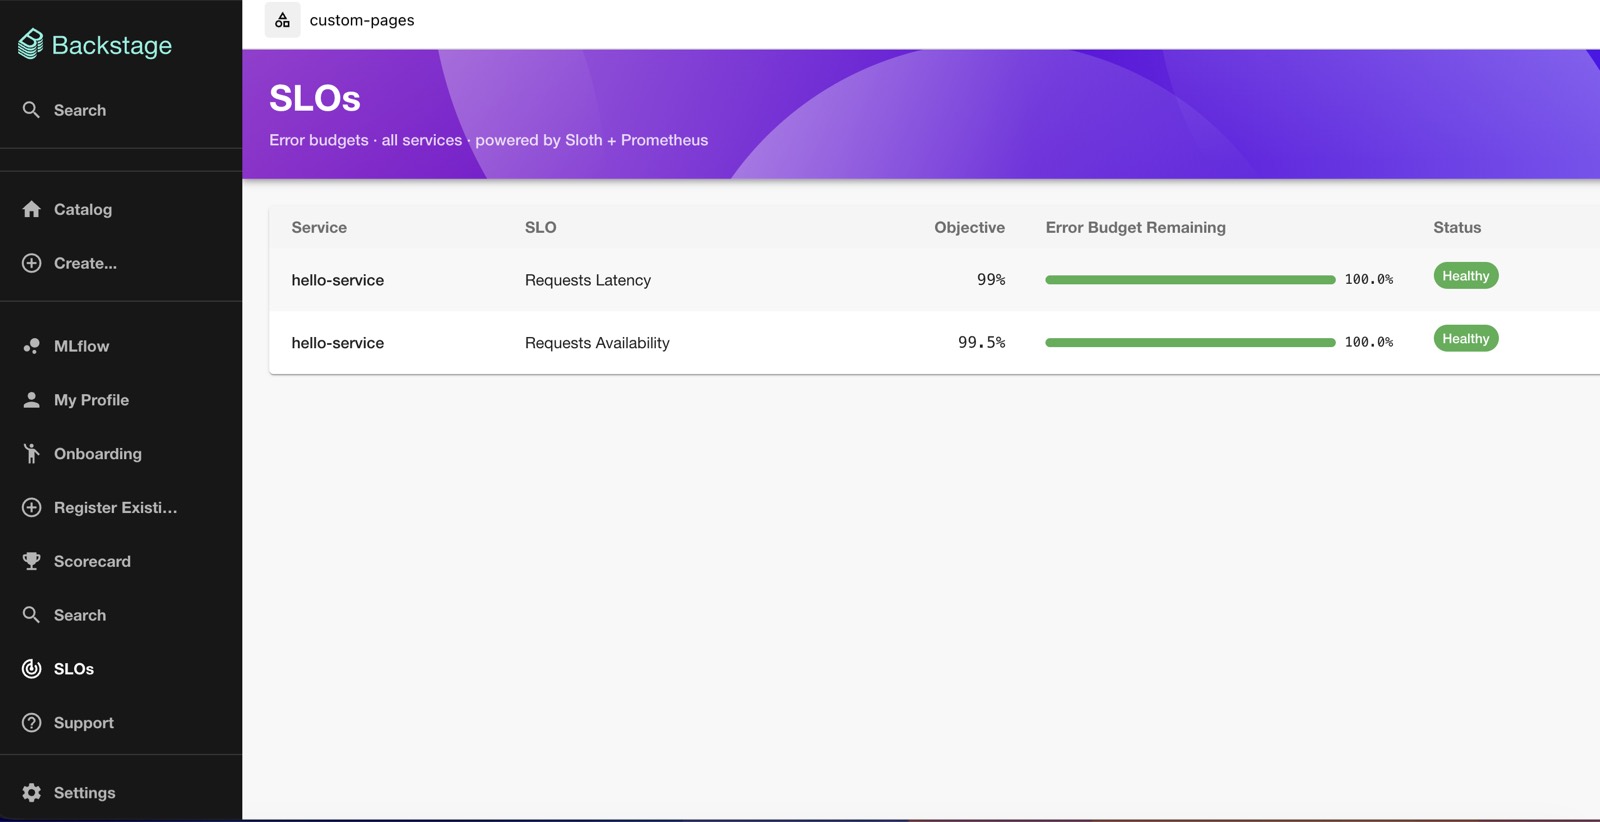
| SLOs and error budgets | QA platform metrics |
|---|---|
 |
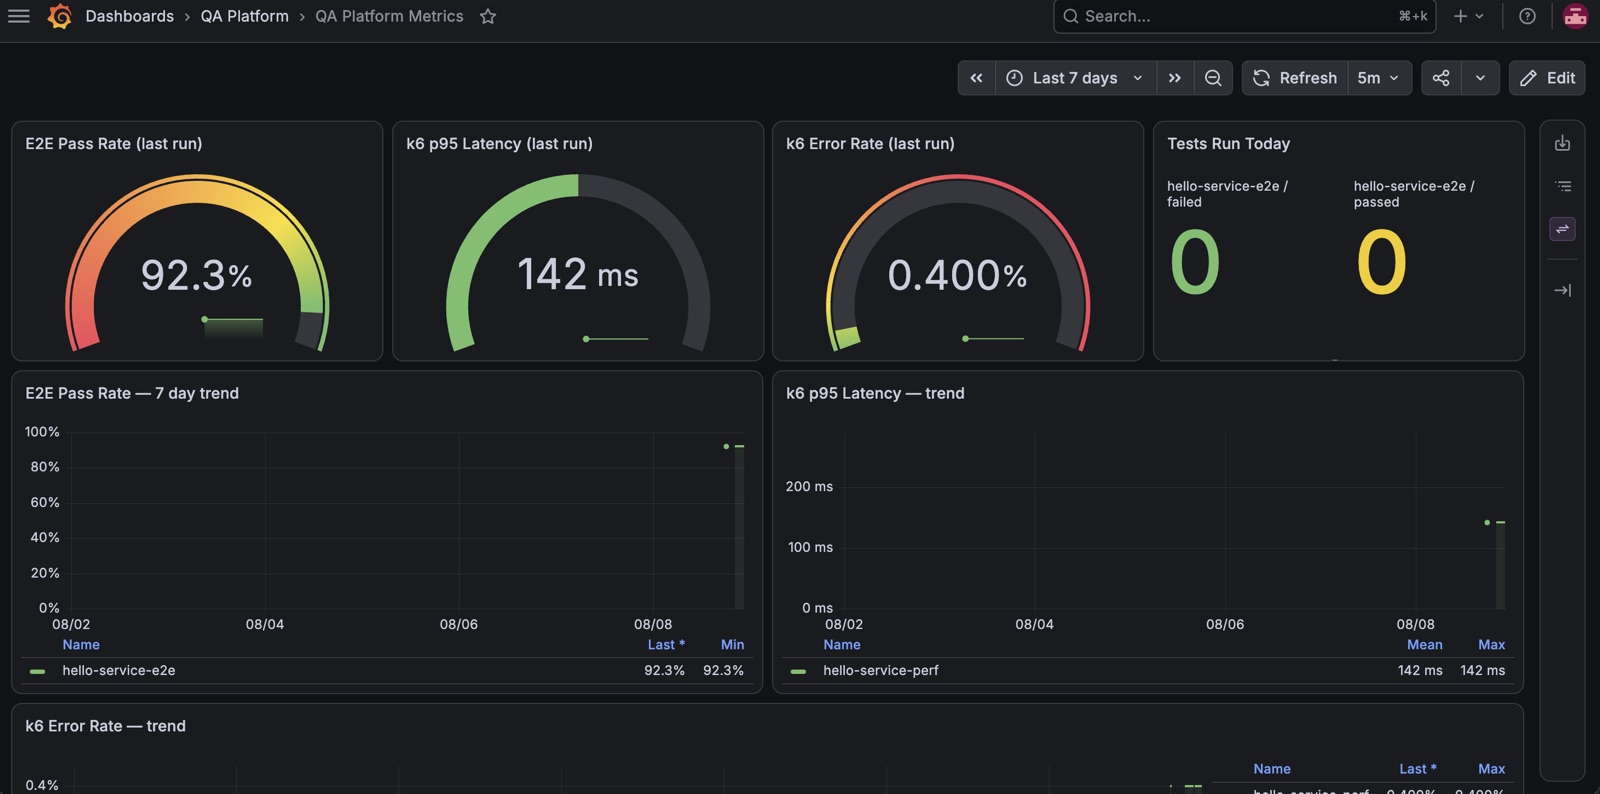 |
| Sloth multi-window burn-rate, live from Prometheus | E2E pass rate, k6 p95 latency and error rate per run |
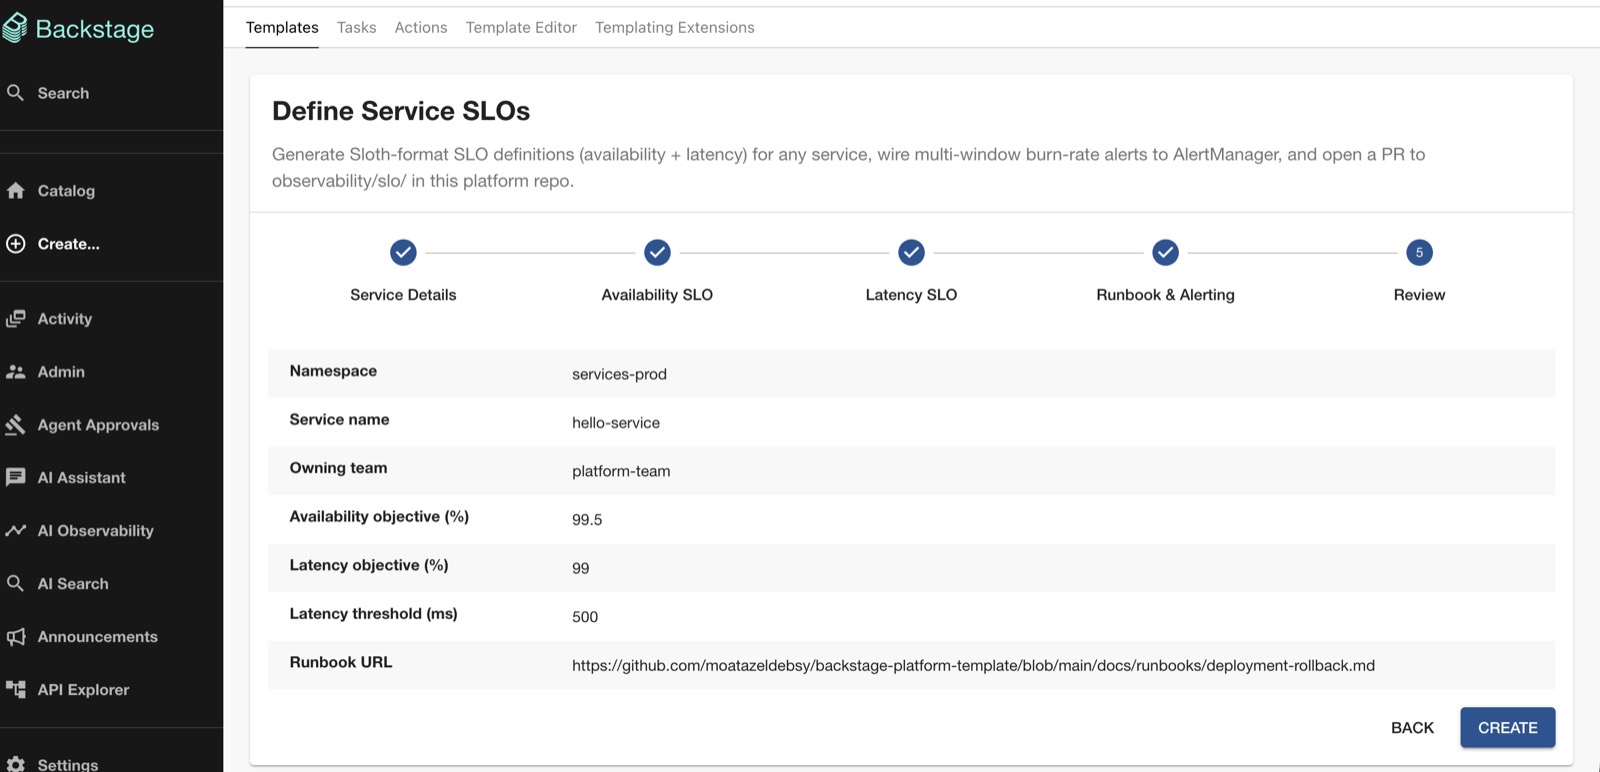
Those SLOs aren't hand-written YAML — a template generates the Sloth definitions and burn-rate alerts and opens the PR:
AI/ML platform and agents
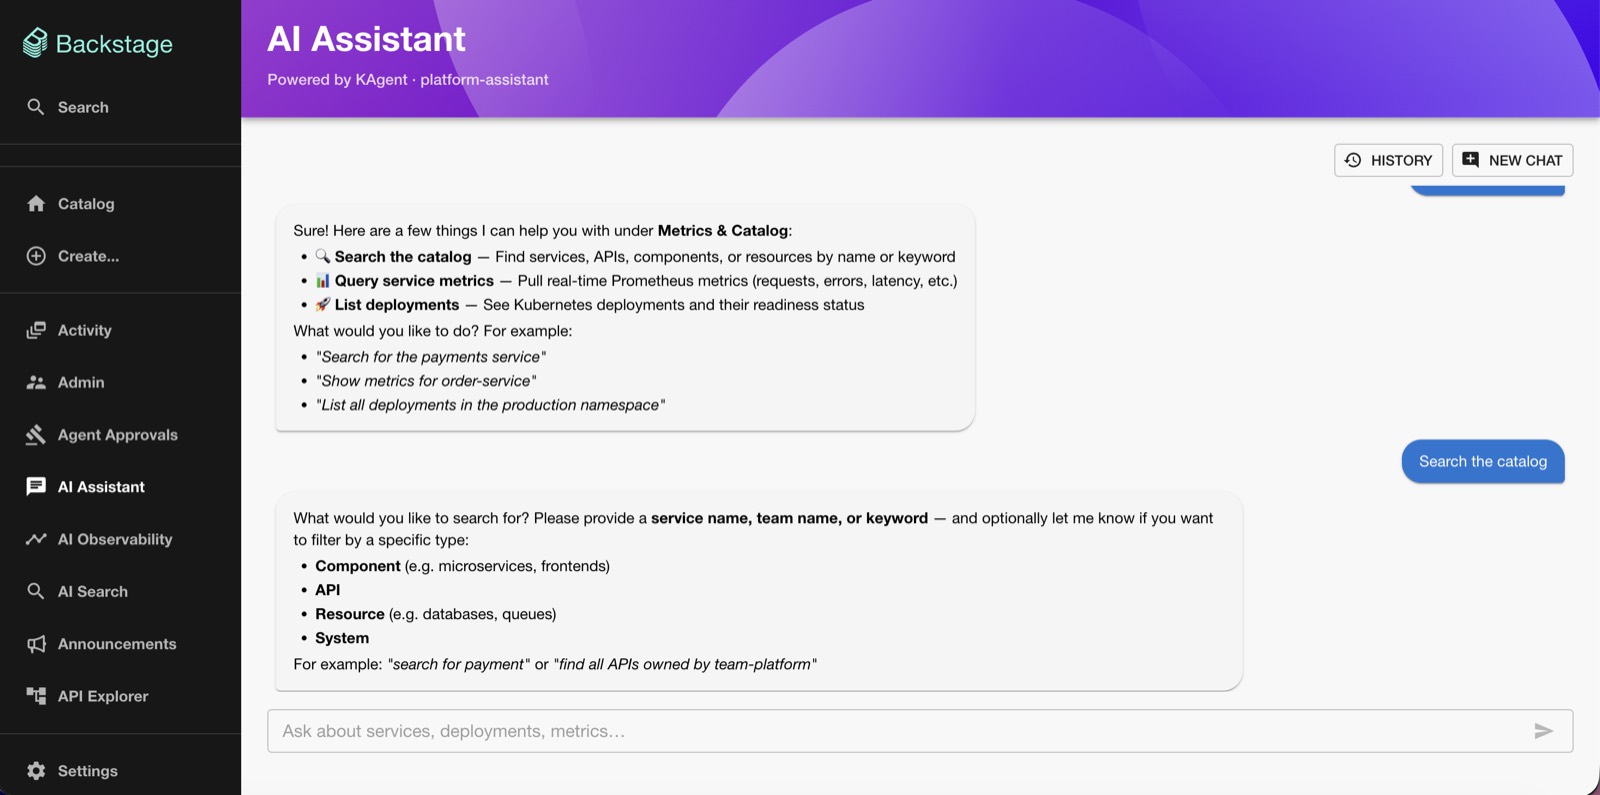
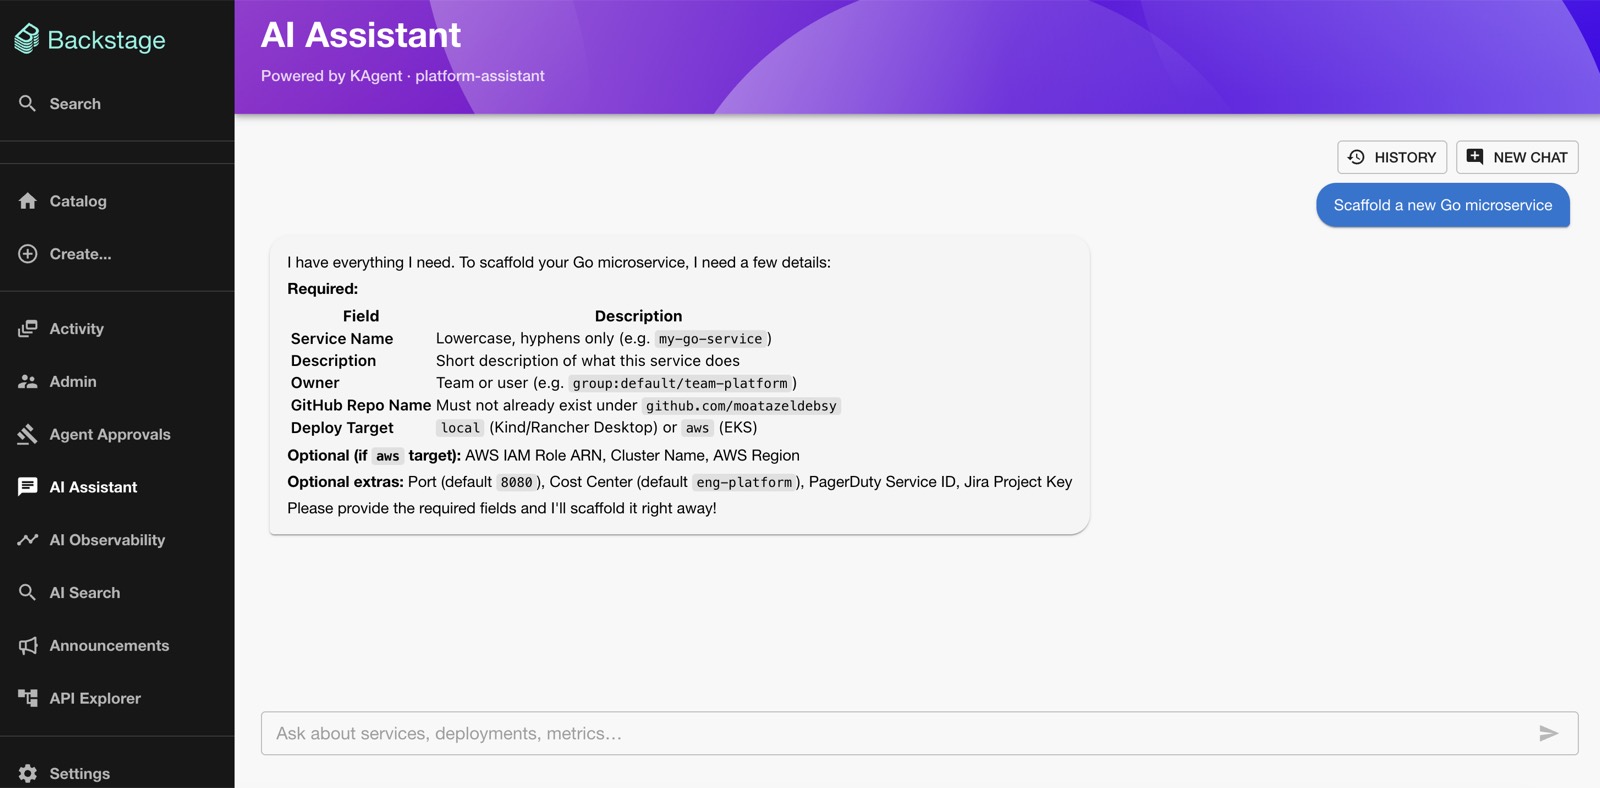
The AI Assistant answers in plans, not prose — it maps your intent onto the actual templates on the platform and asks for exactly the inputs they need:
| Ask it anything | It plans the scaffold |
|---|---|
 |
 |
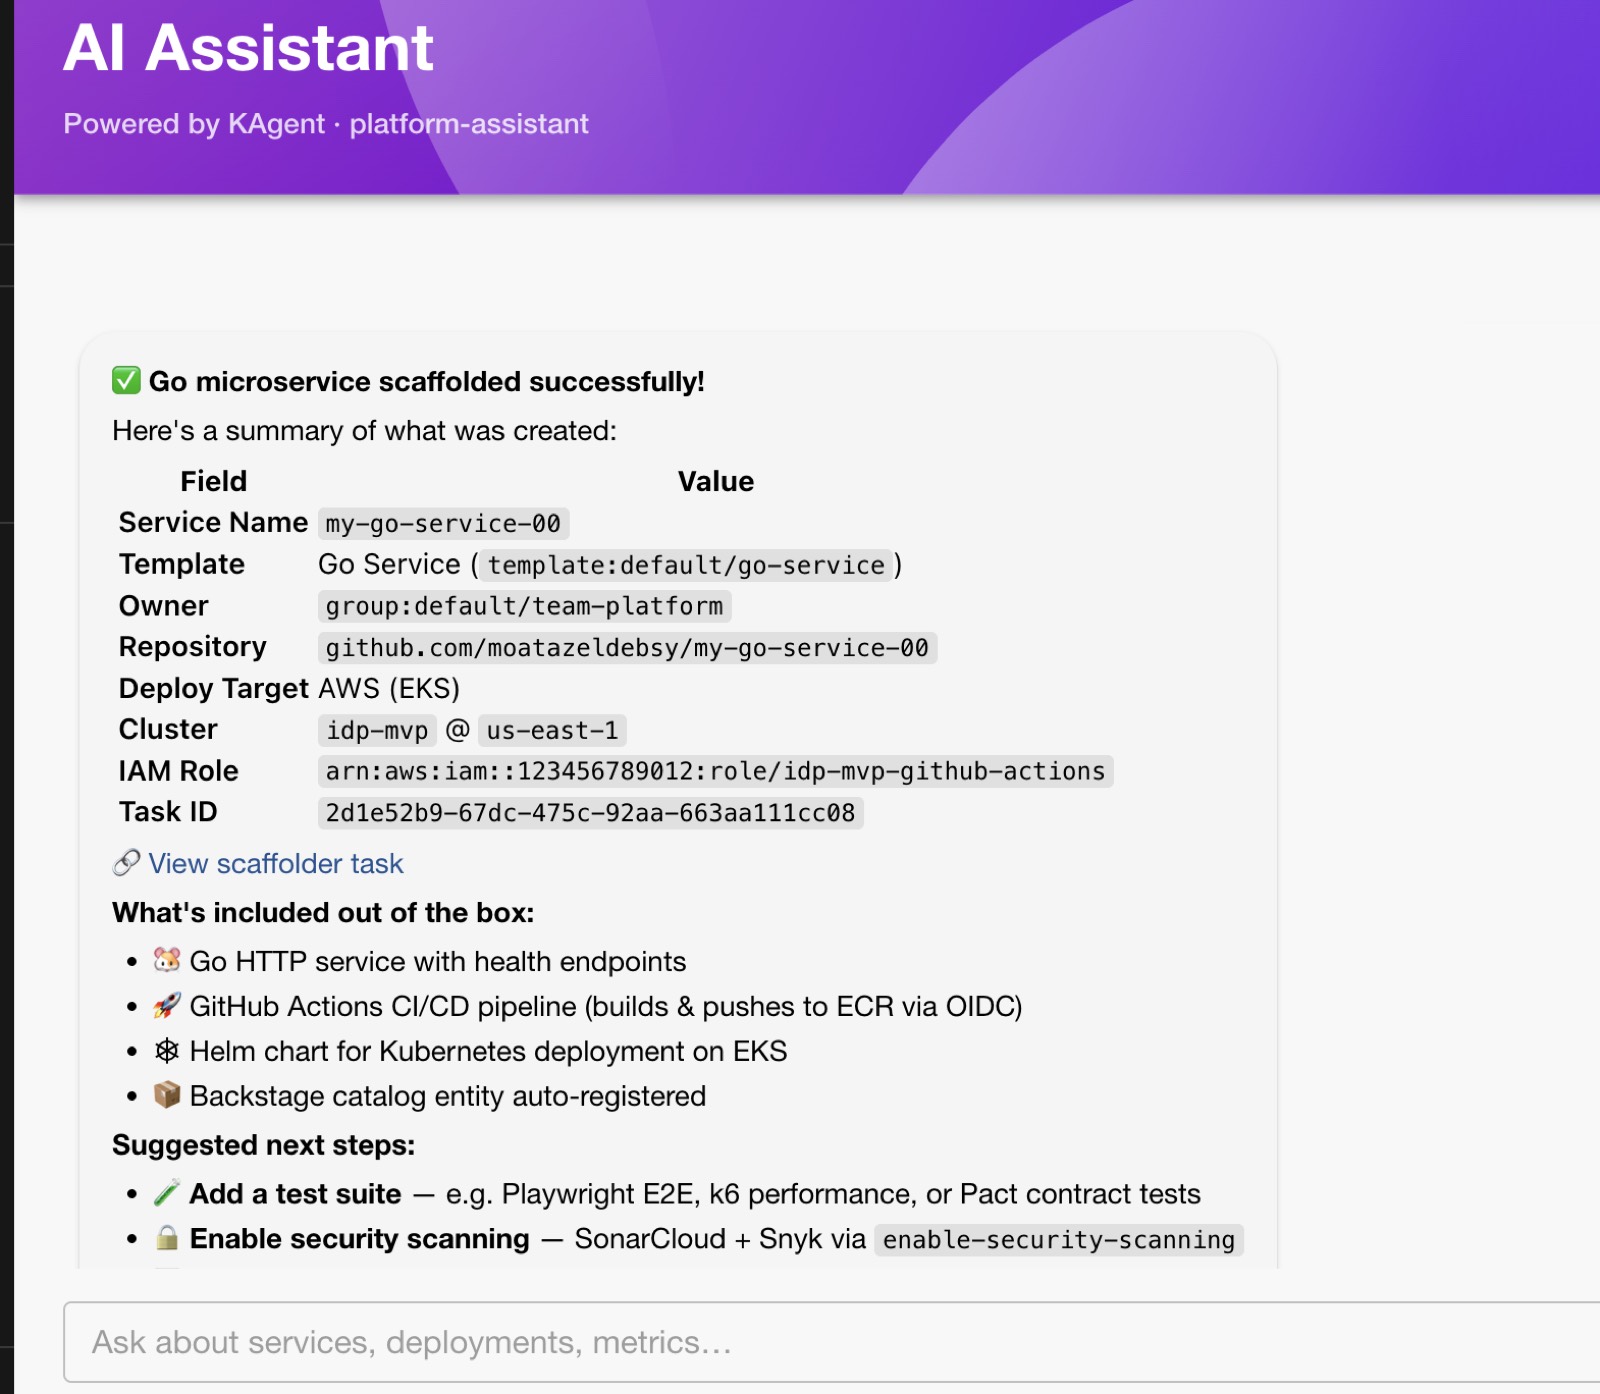
…and then it actually runs the scaffolder — repo, deploy target, task ID and the suggested next steps come back in the same chat:
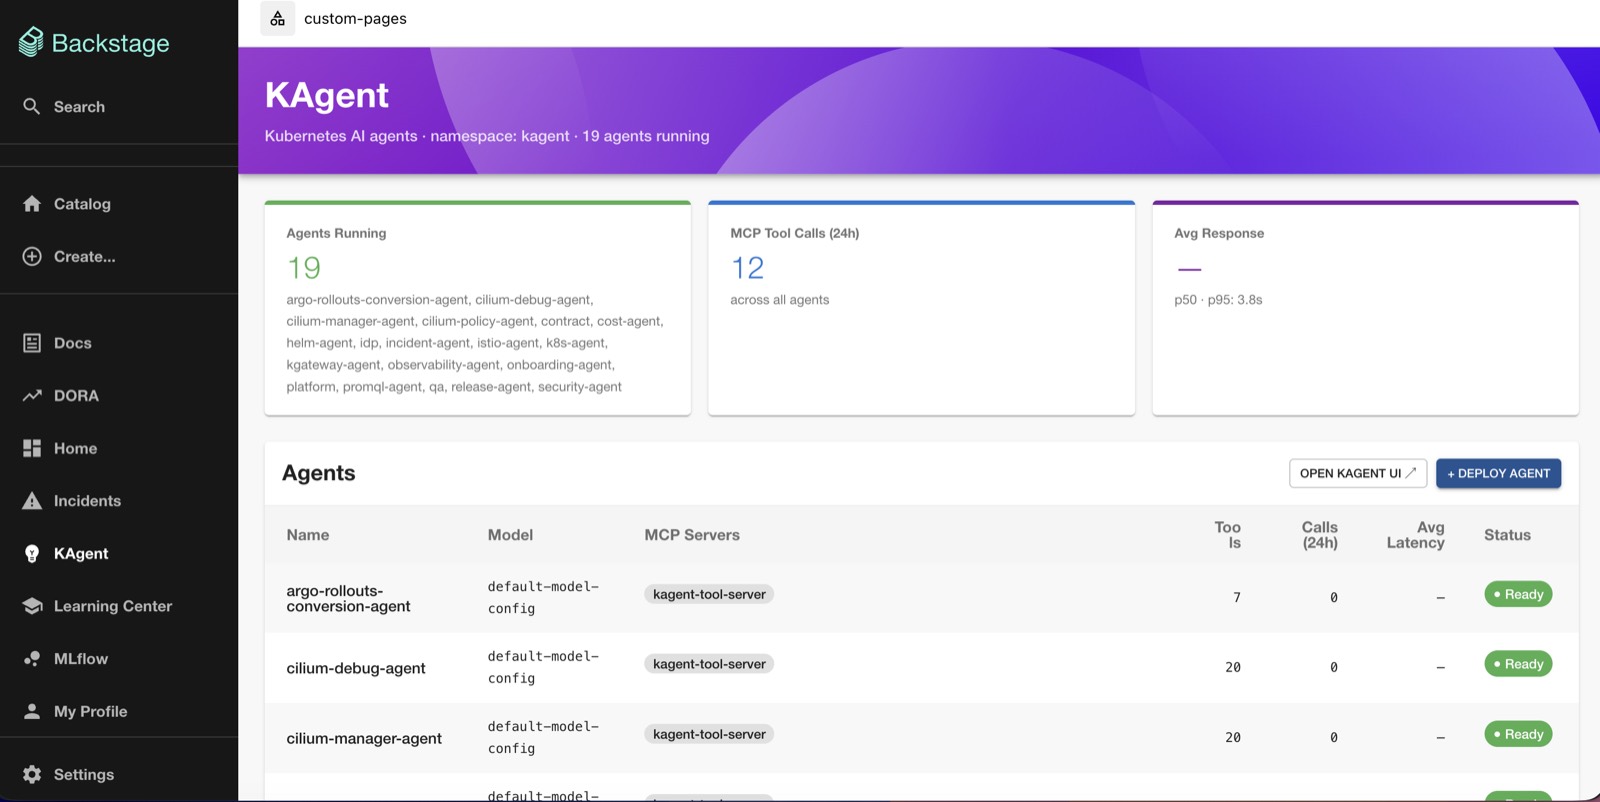
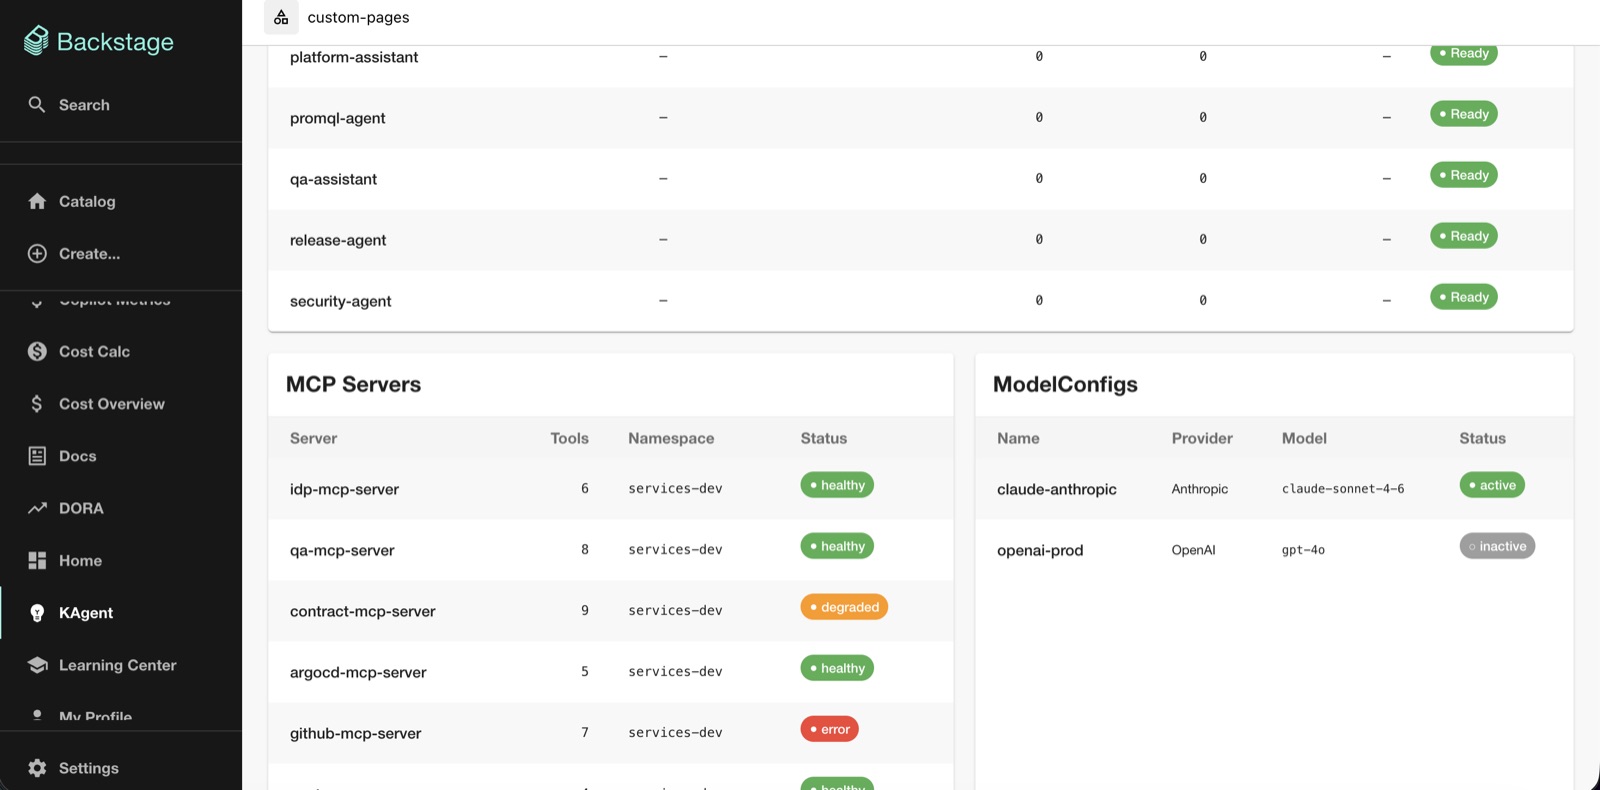
| KAgent agents | MCP servers and model configs |
|---|---|
 |
 |
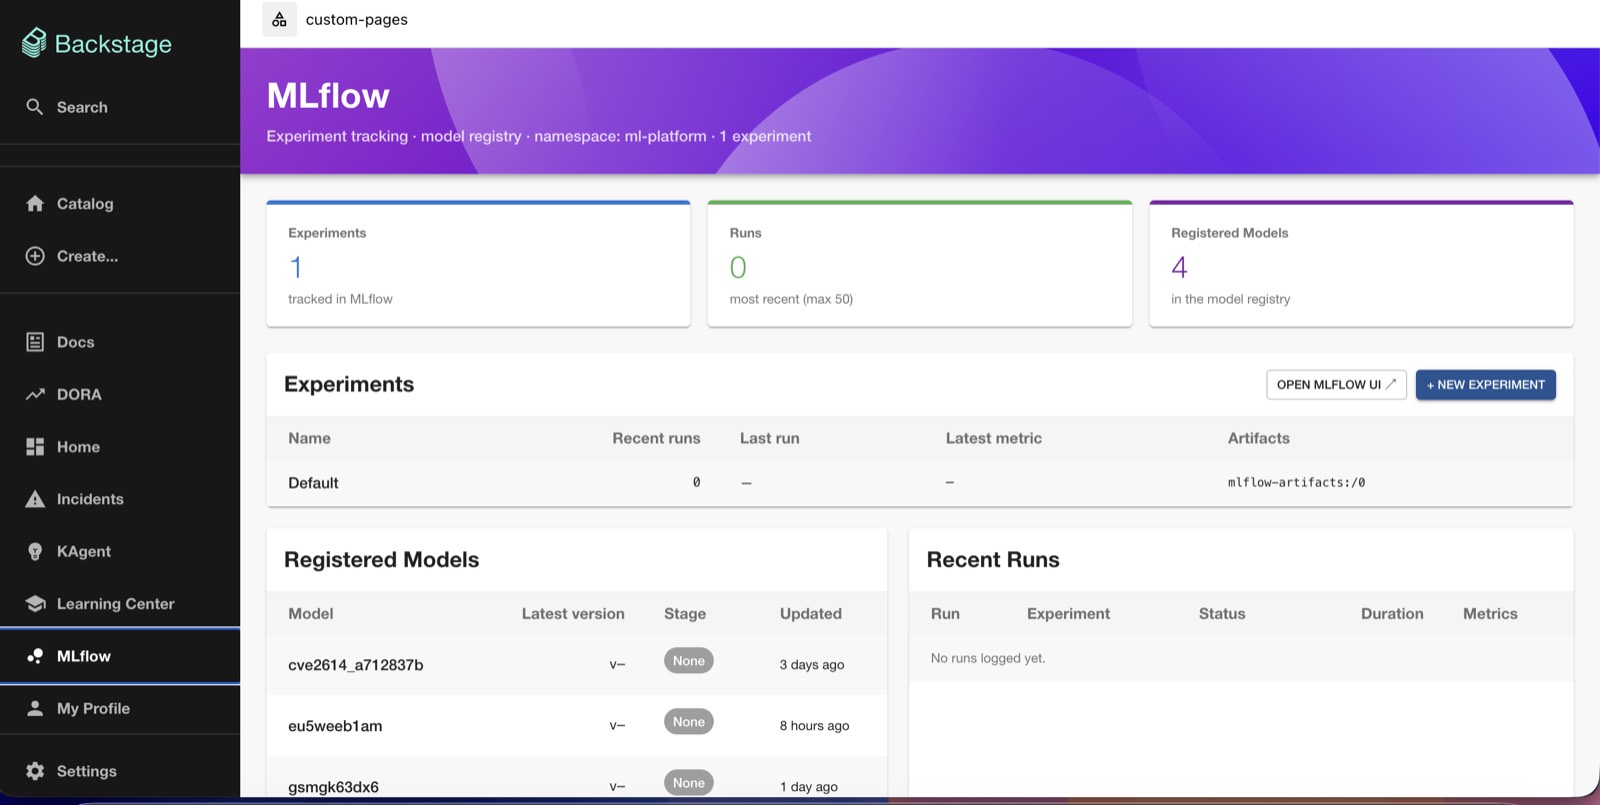
The MLflow page gives experiment tracking and the model registry the same in-portal treatment — experiments, recent runs and registered models, read live from the MLflow API, without leaving the catalog:
| Agent Approvals (HiTL gate) | MLflow's own UI |
|---|---|
 |
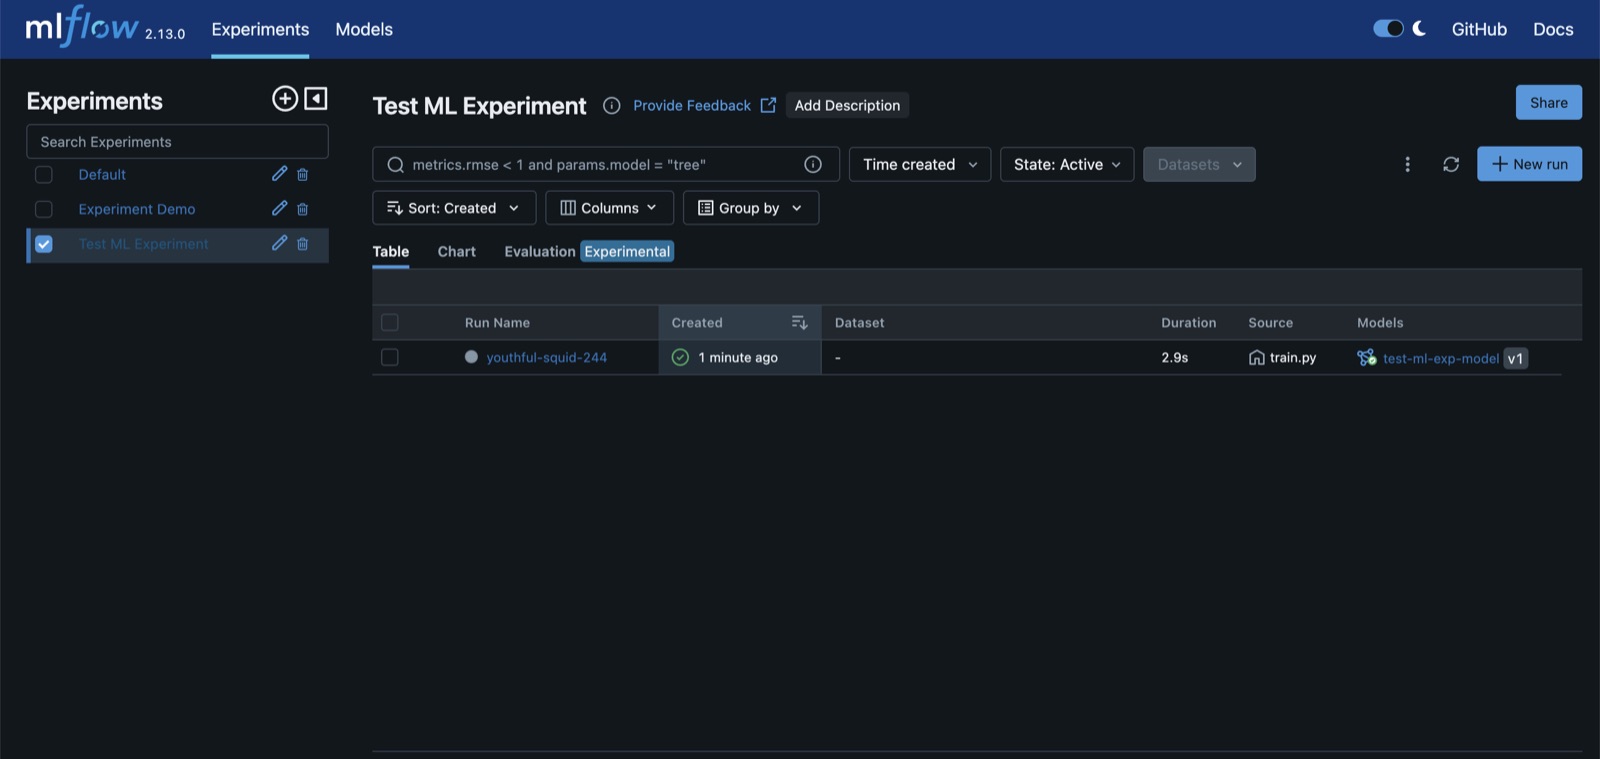 |
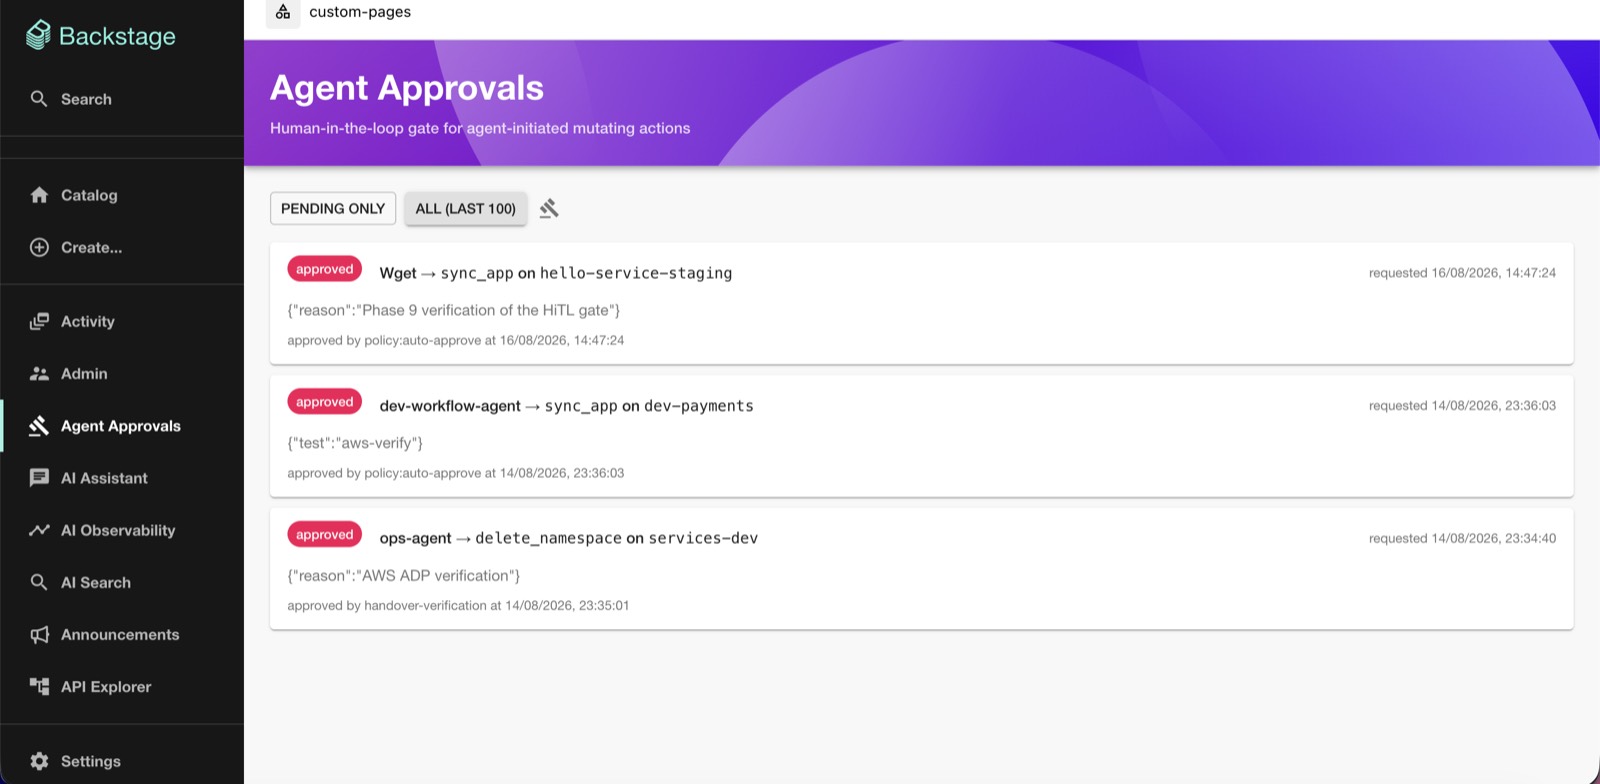
| Every mutating agent action waits for a human — or an auto-approve policy | One click away at mlflow.idp.local, for the deep-dive views |
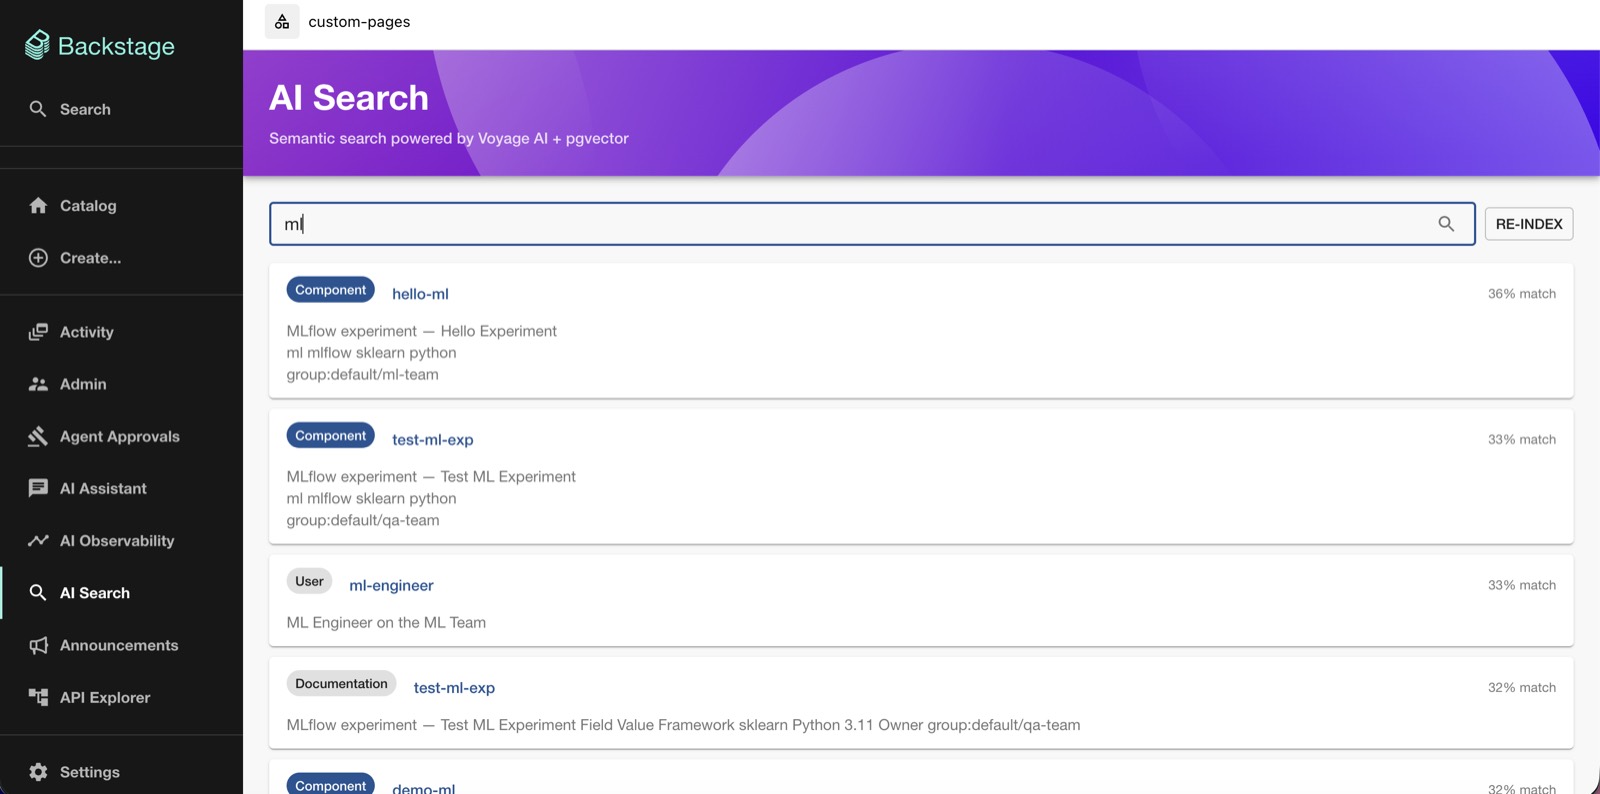
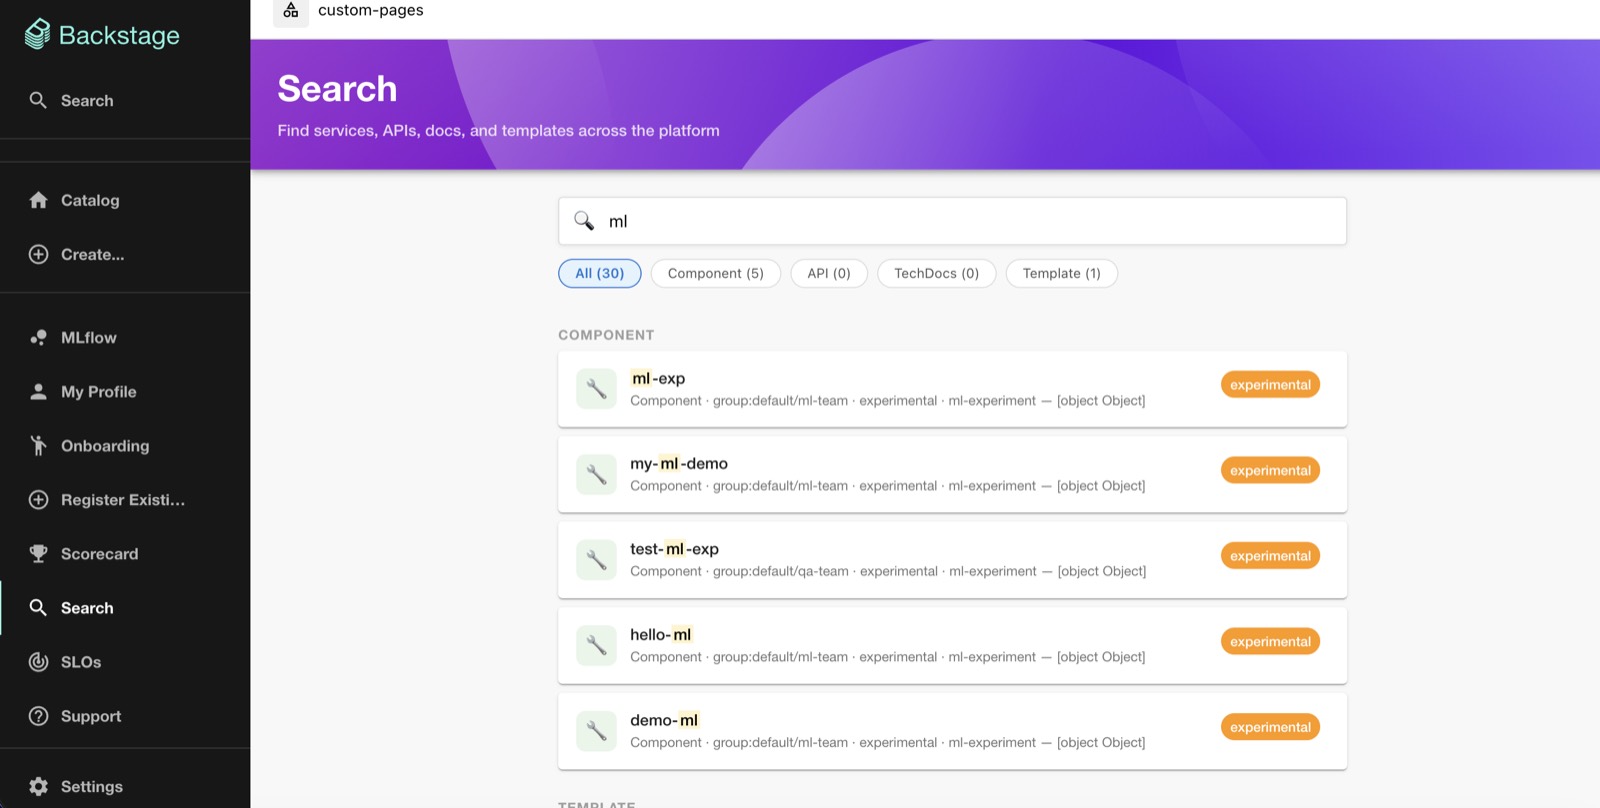
Semantic search over templates, components and TechDocs (Voyage AI + pgvector):
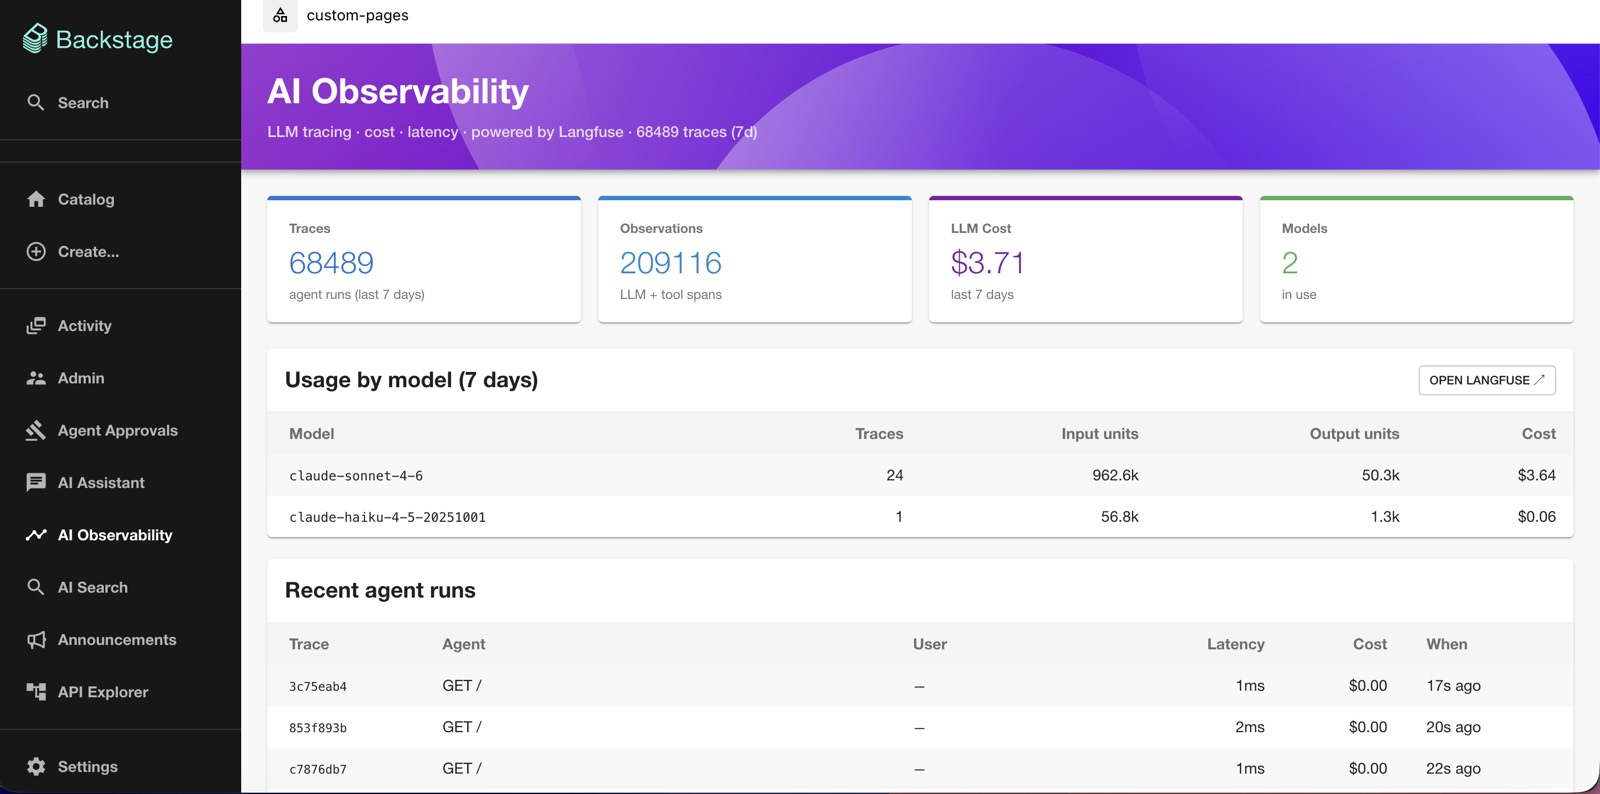
Prometheus tells you that an agent ran. Langfuse tells you what it cost — prompt and completion, tokens, latency and spend per run, without leaving the portal:
| AI Observability in Backstage | The full Langfuse UI |
|---|---|
 |
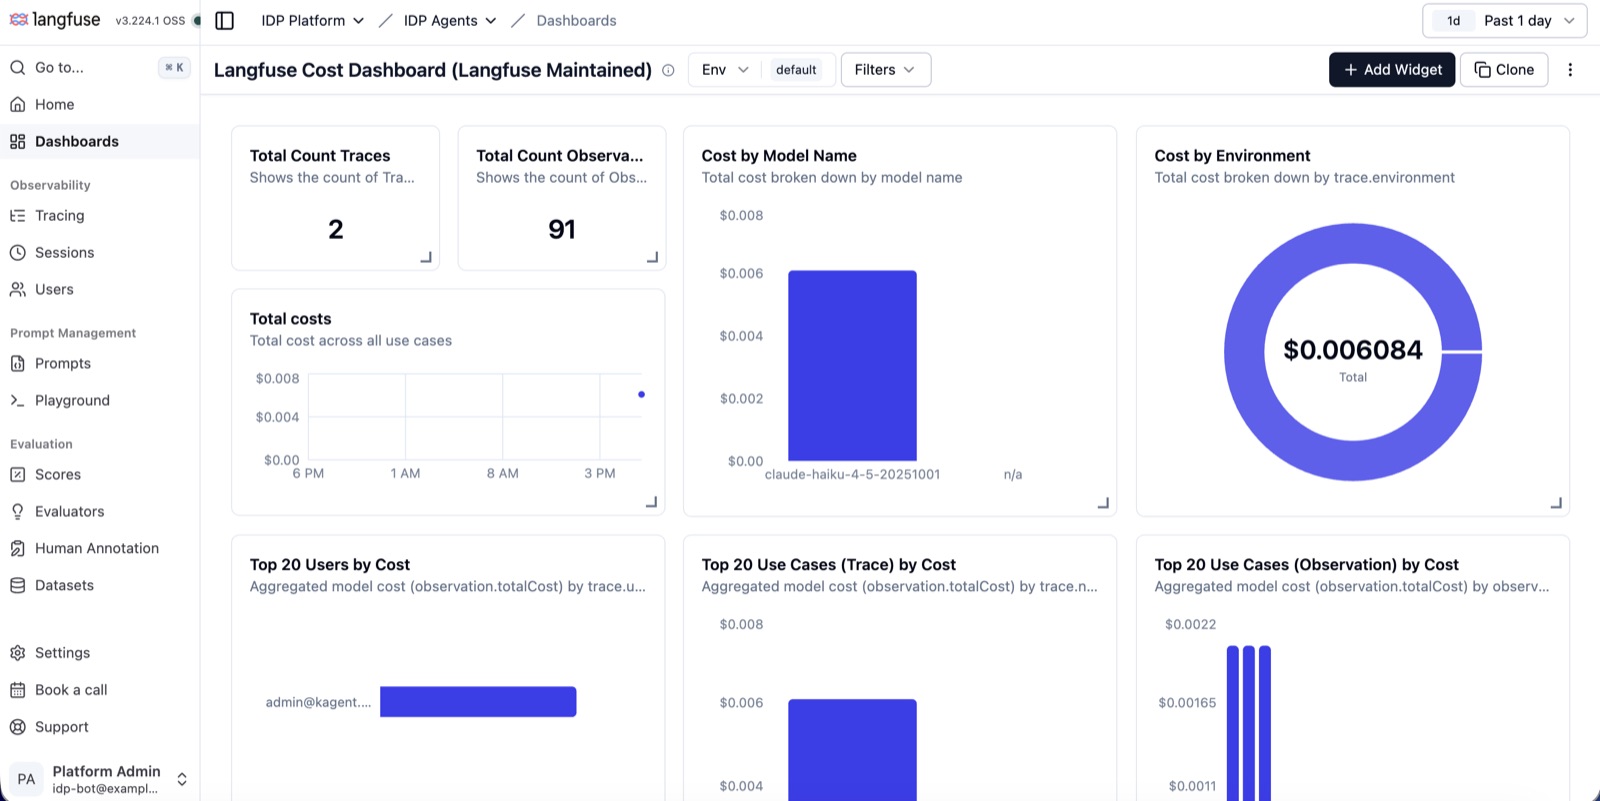 |
| Cost and token usage per model, and recent agent runs with latency | Cost by model and environment, per-user spend, and trace drill-down |
Observability, DORA and FinOps
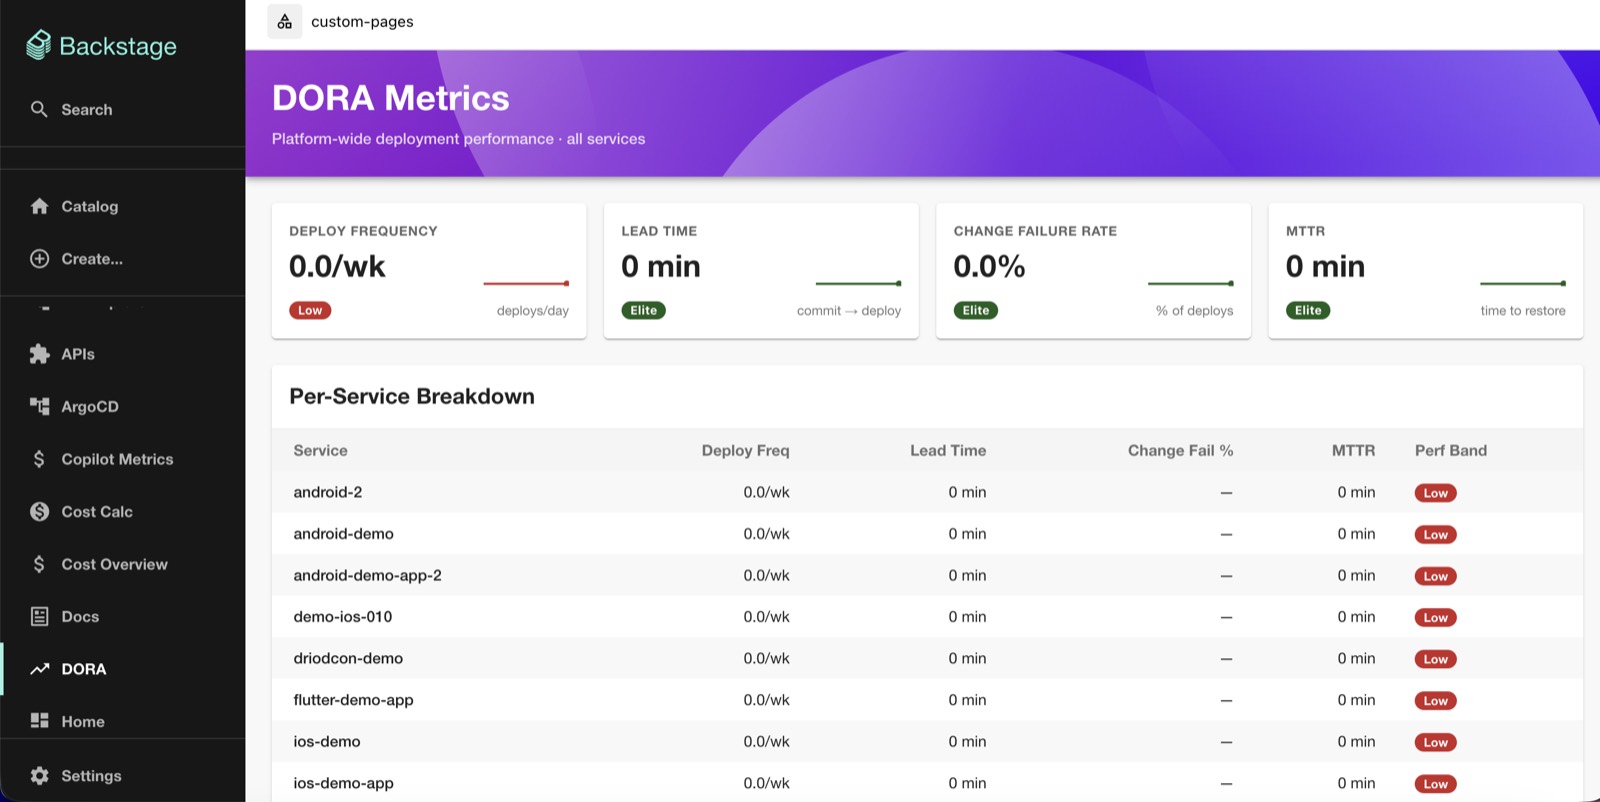
| DORA metrics | FinOps cost overview |
|---|---|
 |
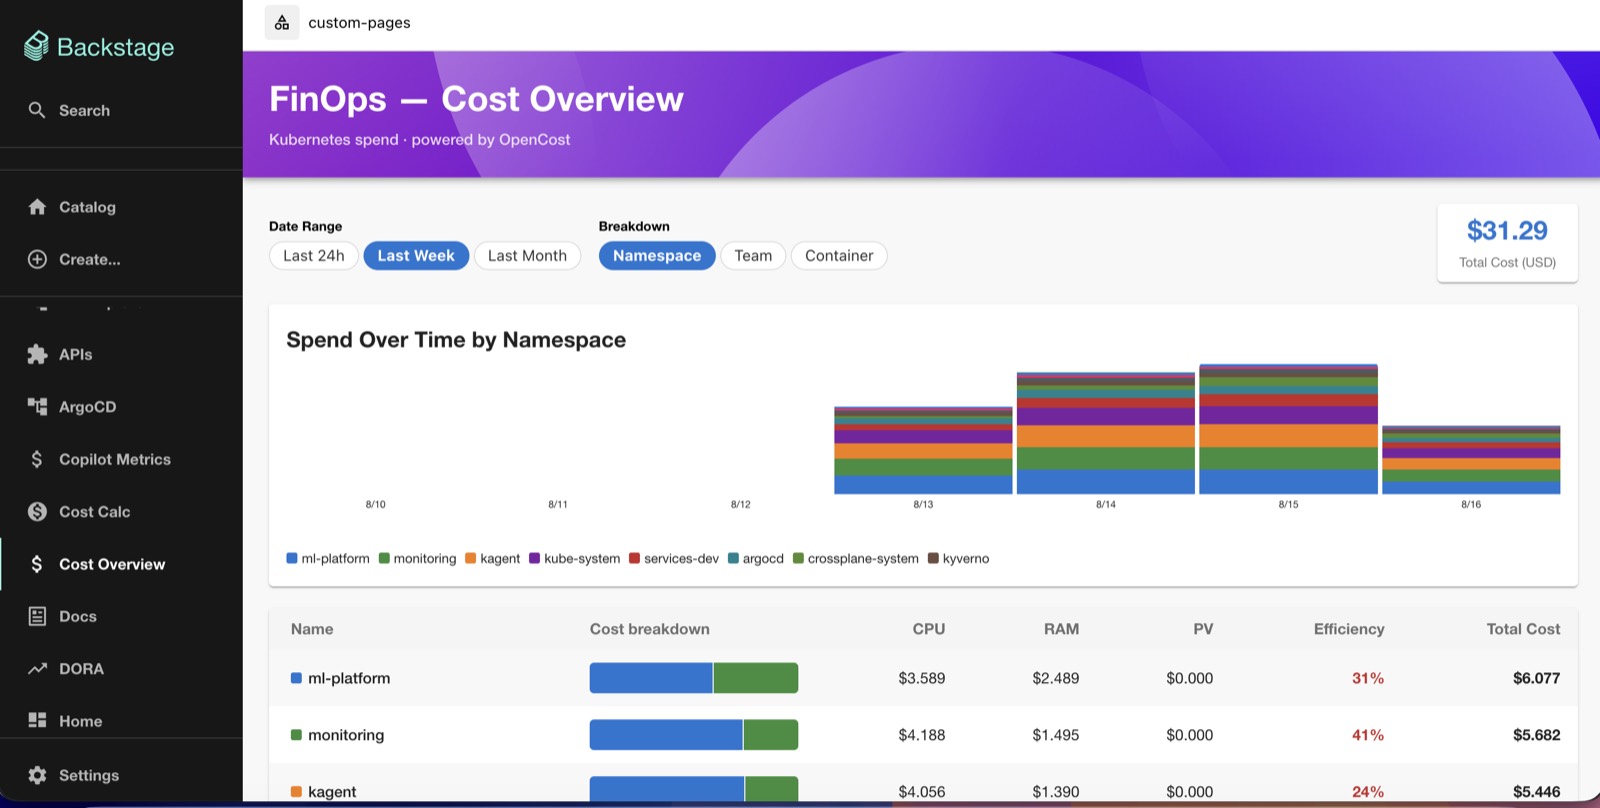 |
| Four keys platform-wide and per service, with performance bands | OpenCost spend by namespace, team or container |
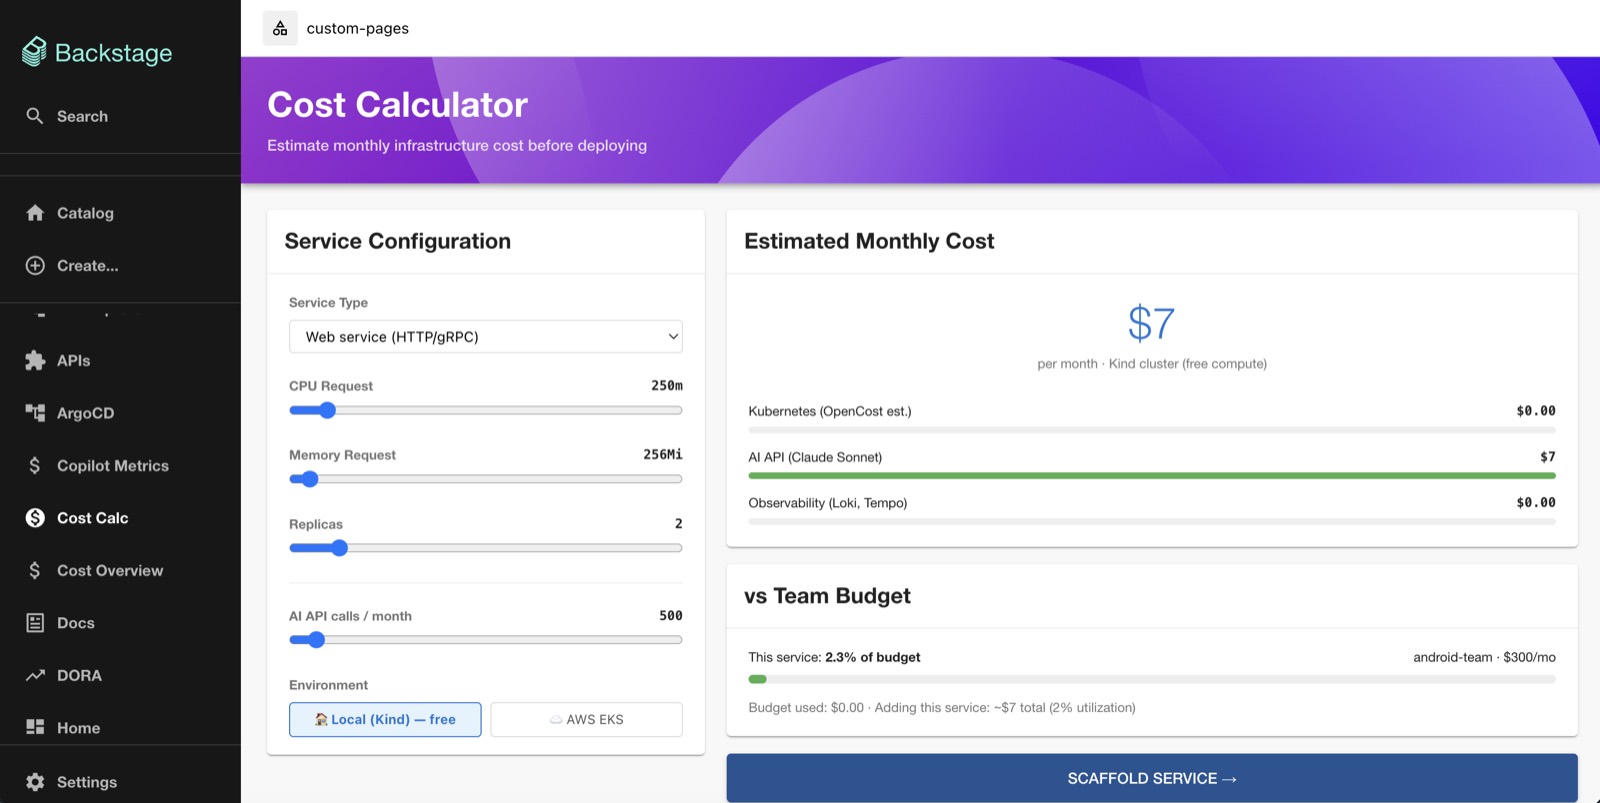
| Cost Calculator | Grafana — IDP services |
|---|---|
 |
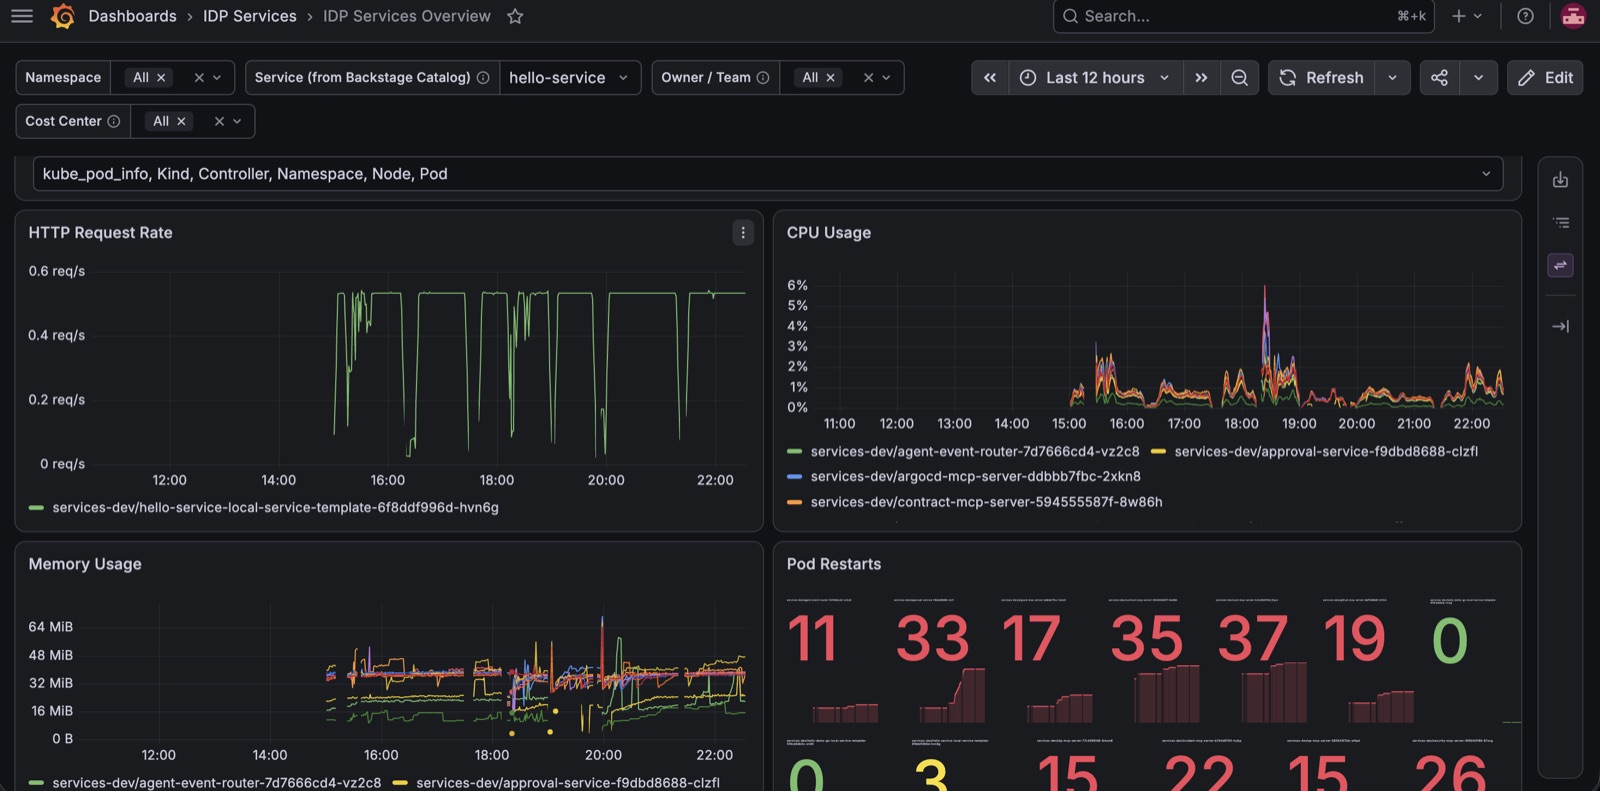 |
| Estimate a service's monthly cost before scaffolding it | Request rate, CPU/memory and restarts, filtered by catalog entity |
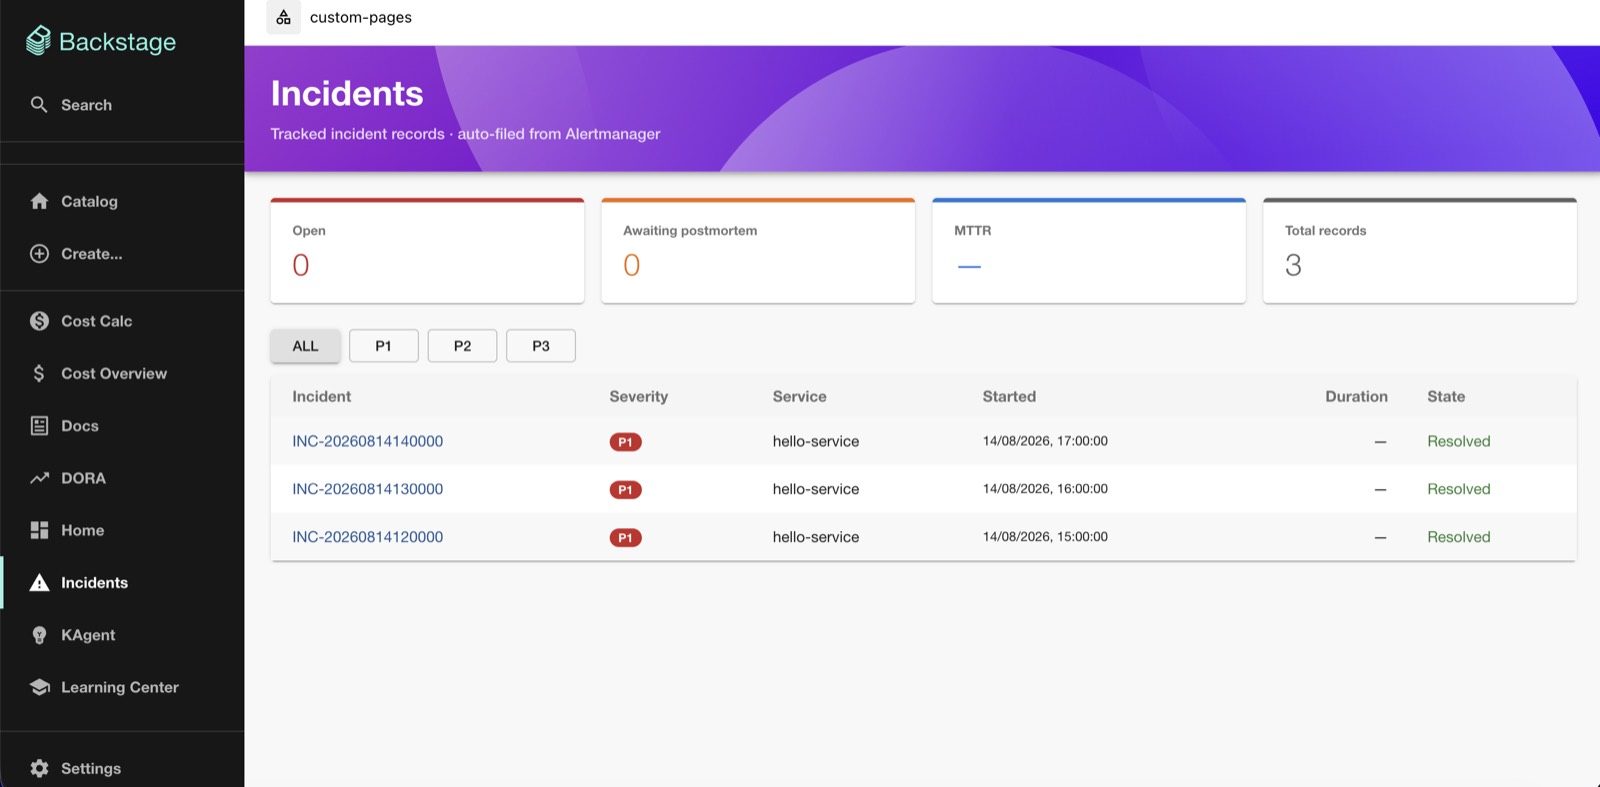
Incidents are records, not Slack threads — auto-filed from Alertmanager, severity-filtered, and feeding MTTR back into DORA:
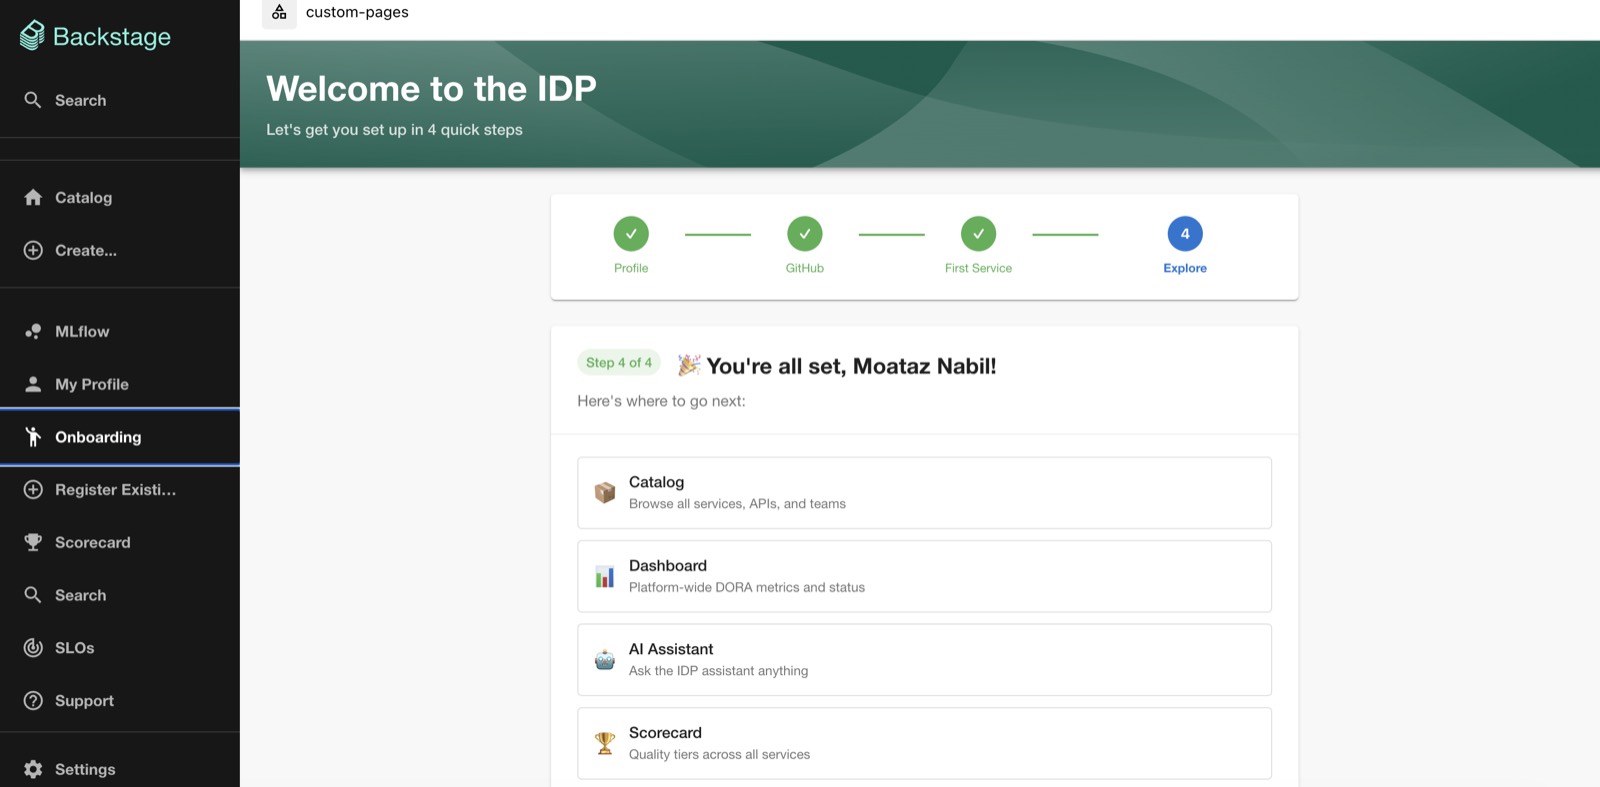
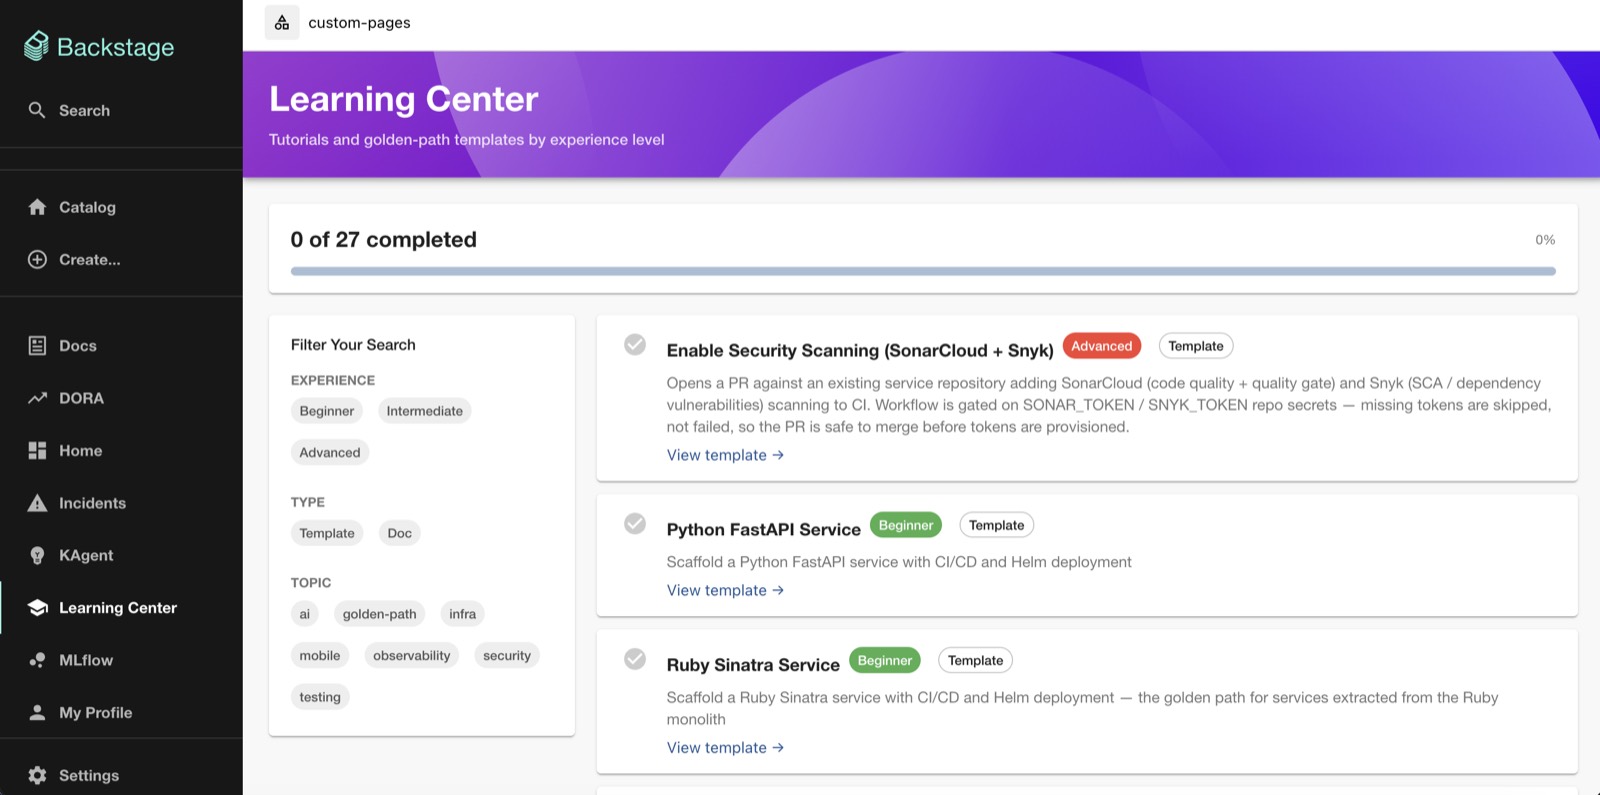
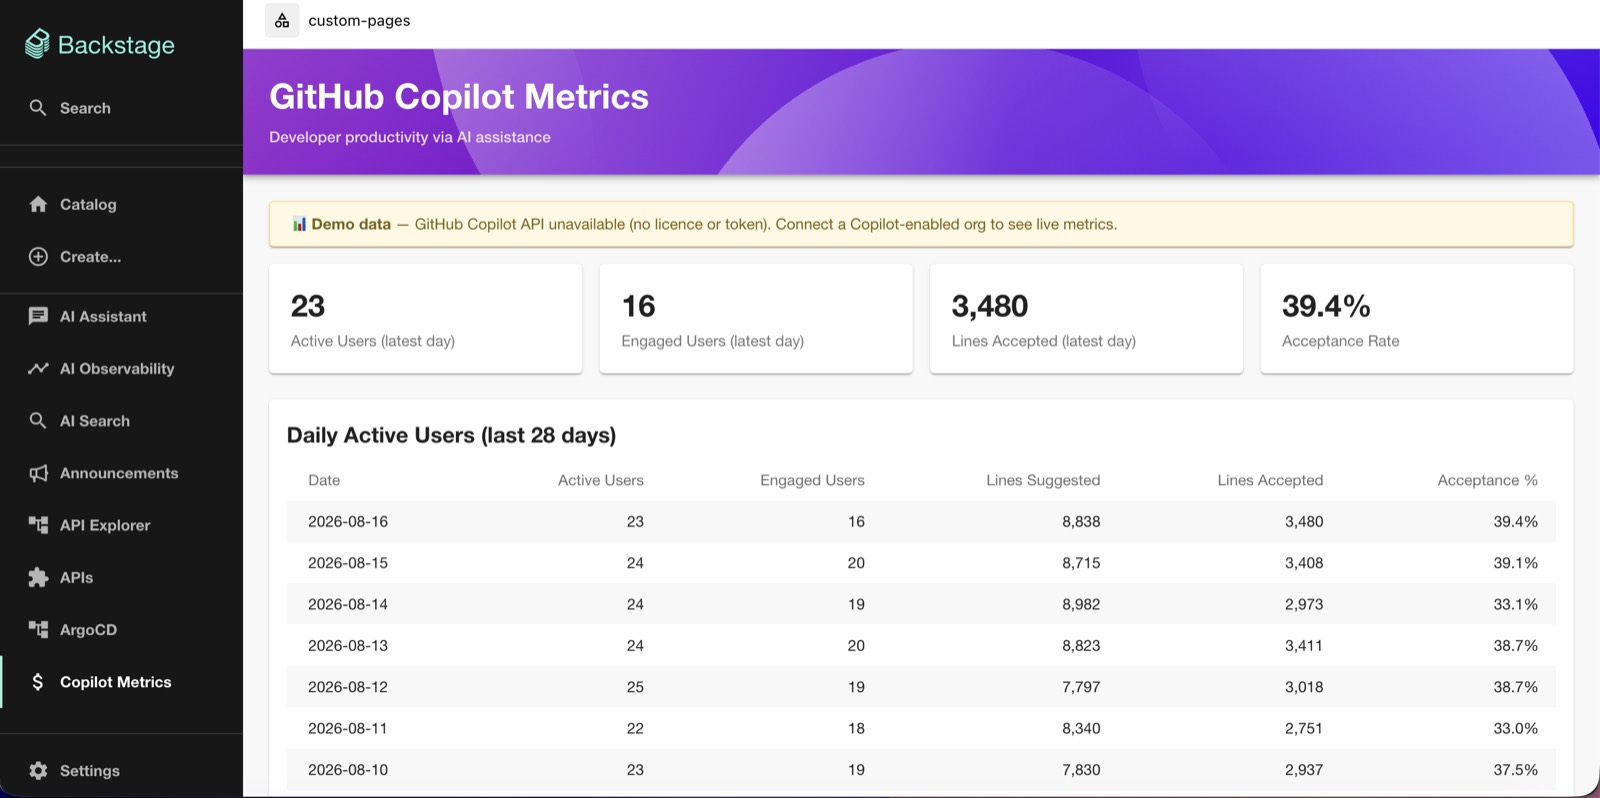
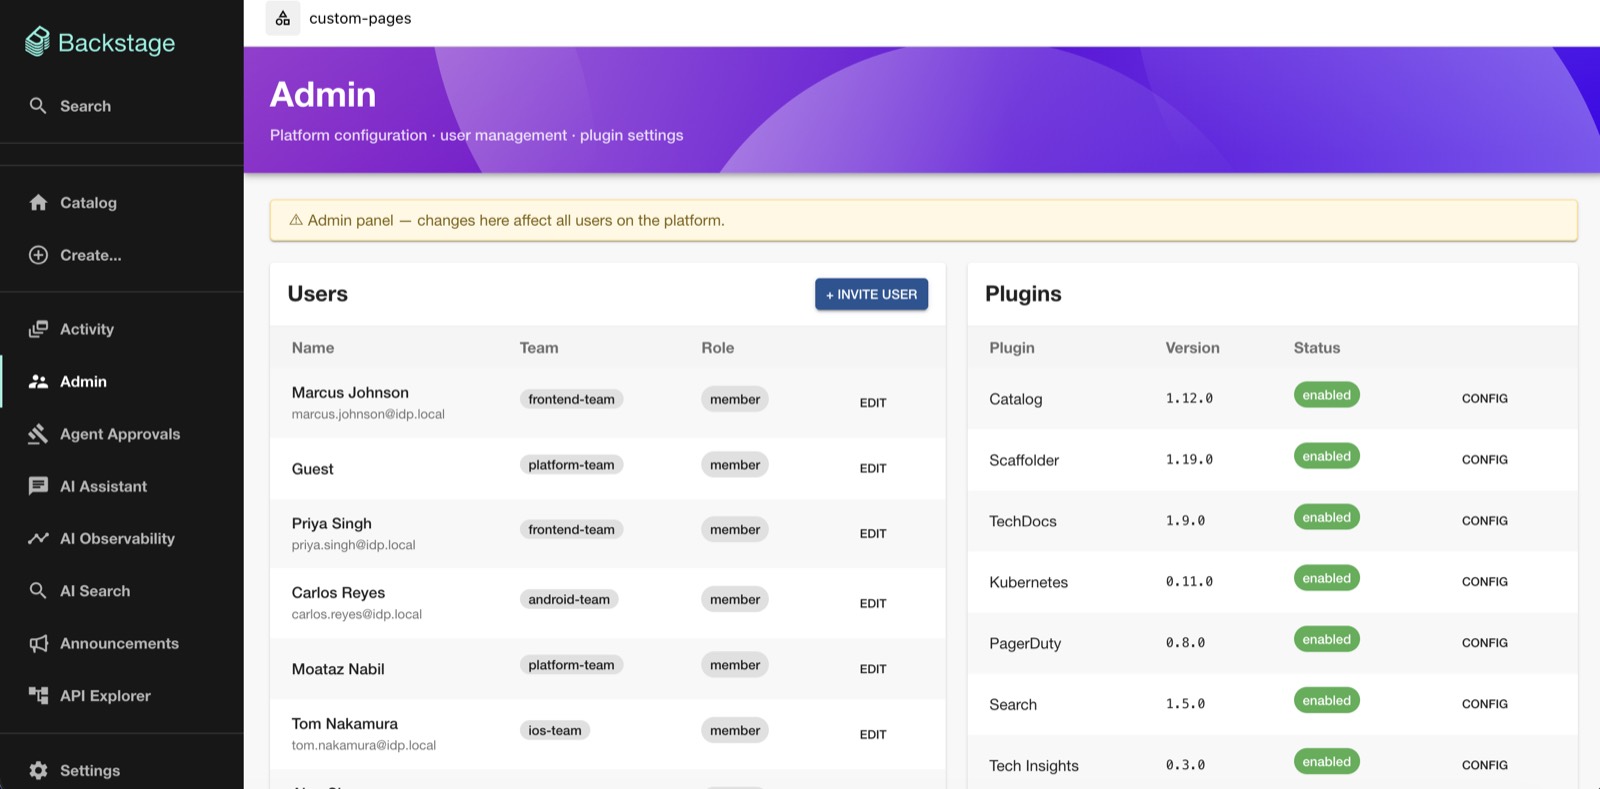
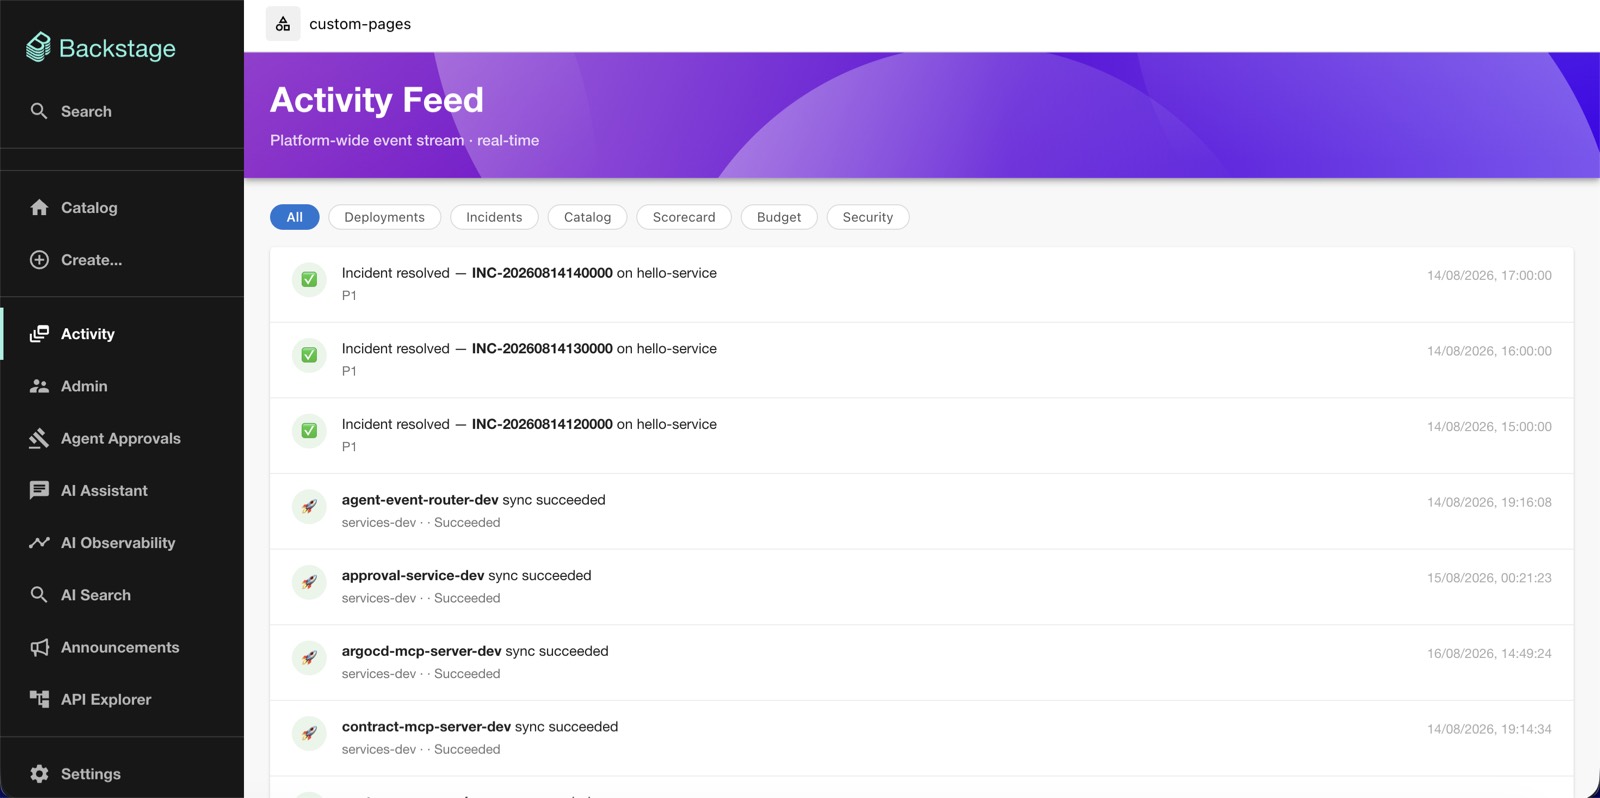
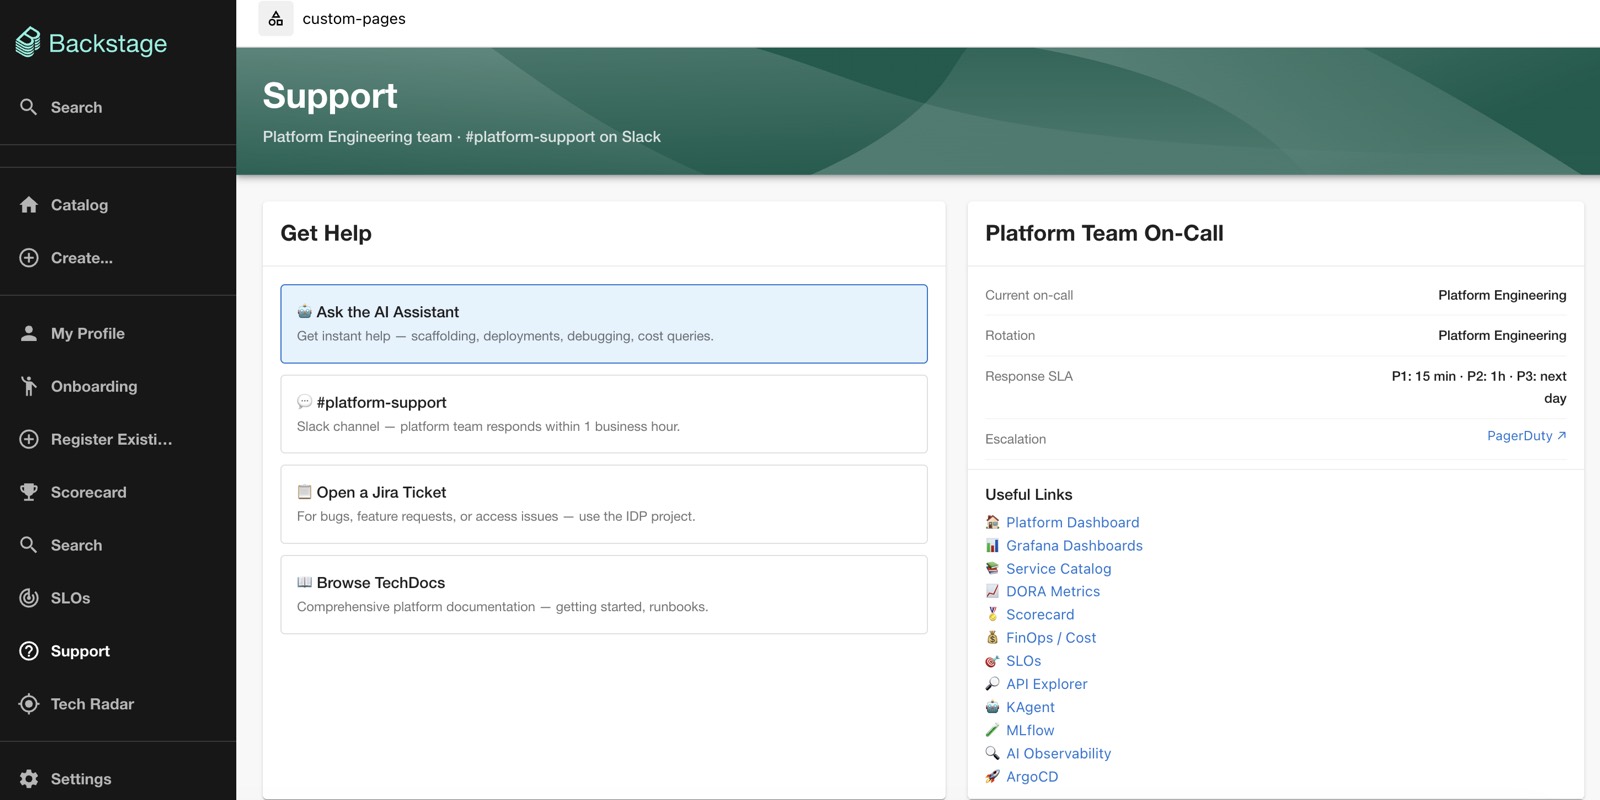
More screens — Tech Radar, onboarding, Learning Center, API explorer, Copilot metrics, admin, activity feed, search, support
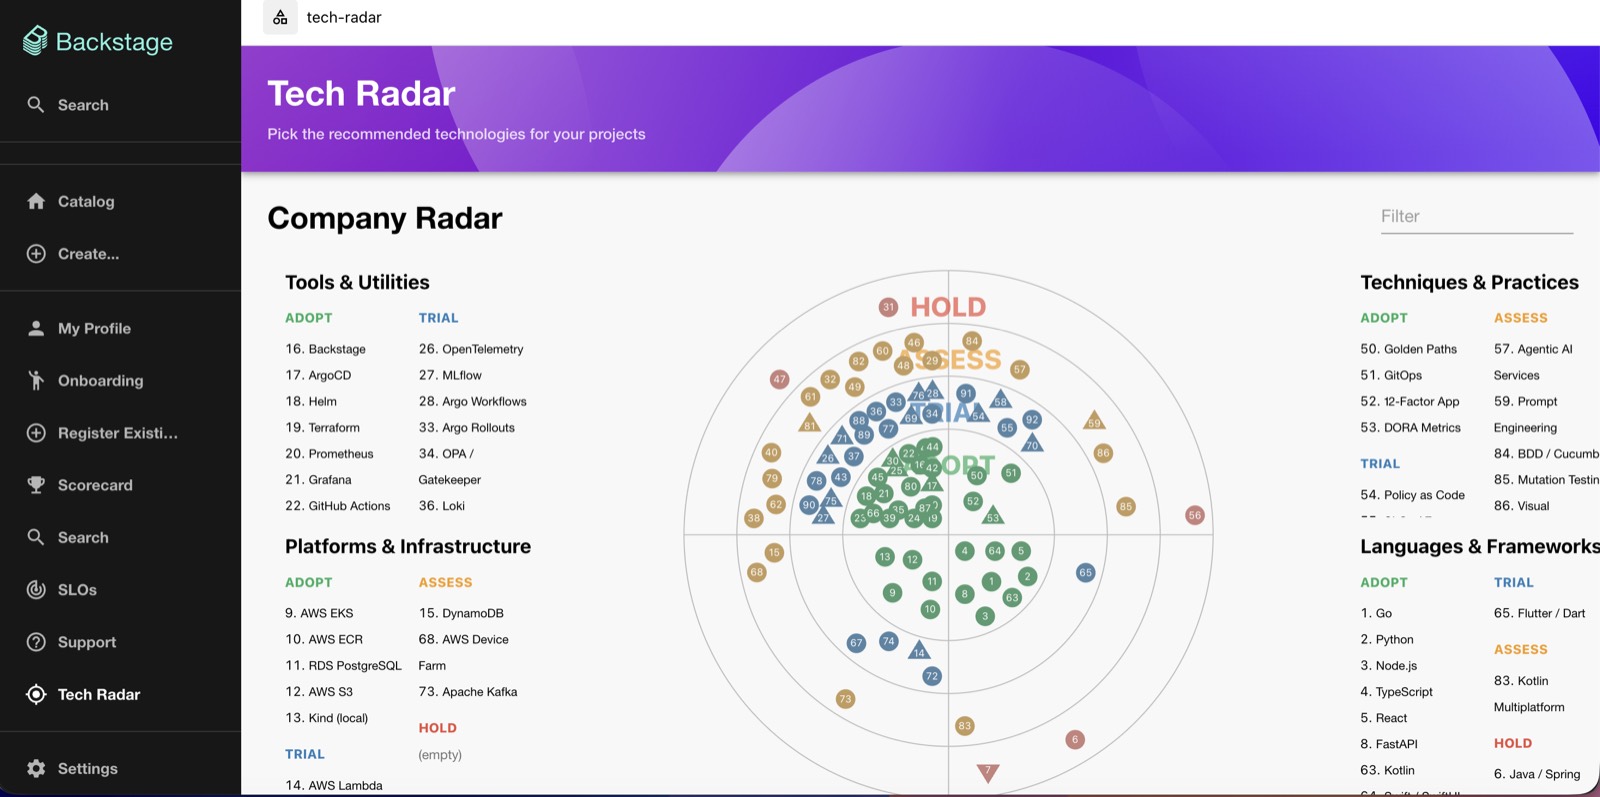
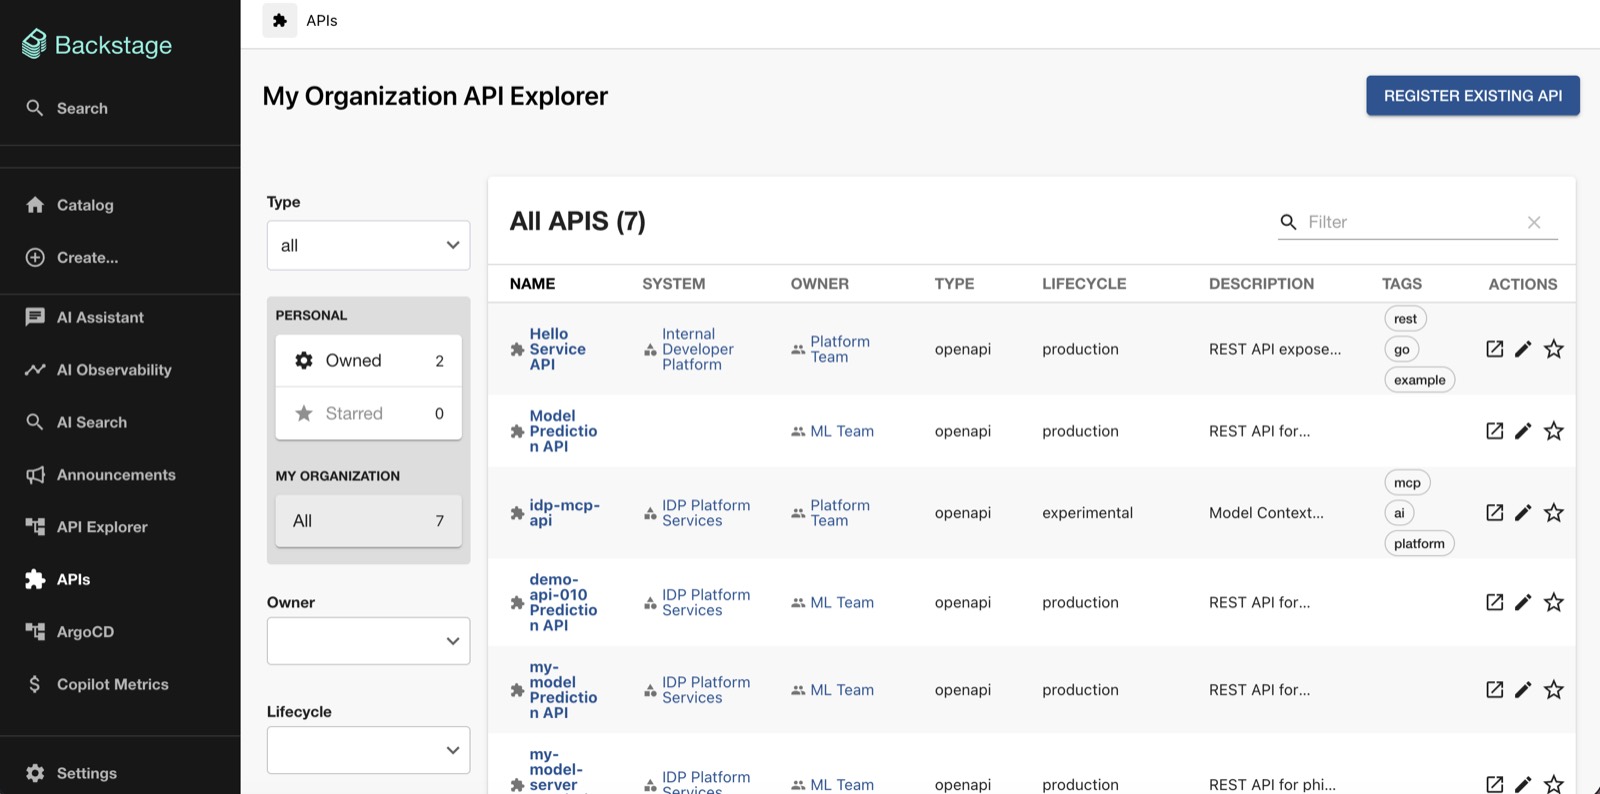
| Tech Radar (92 entries) | API Explorer |
|---|---|
 |
 |
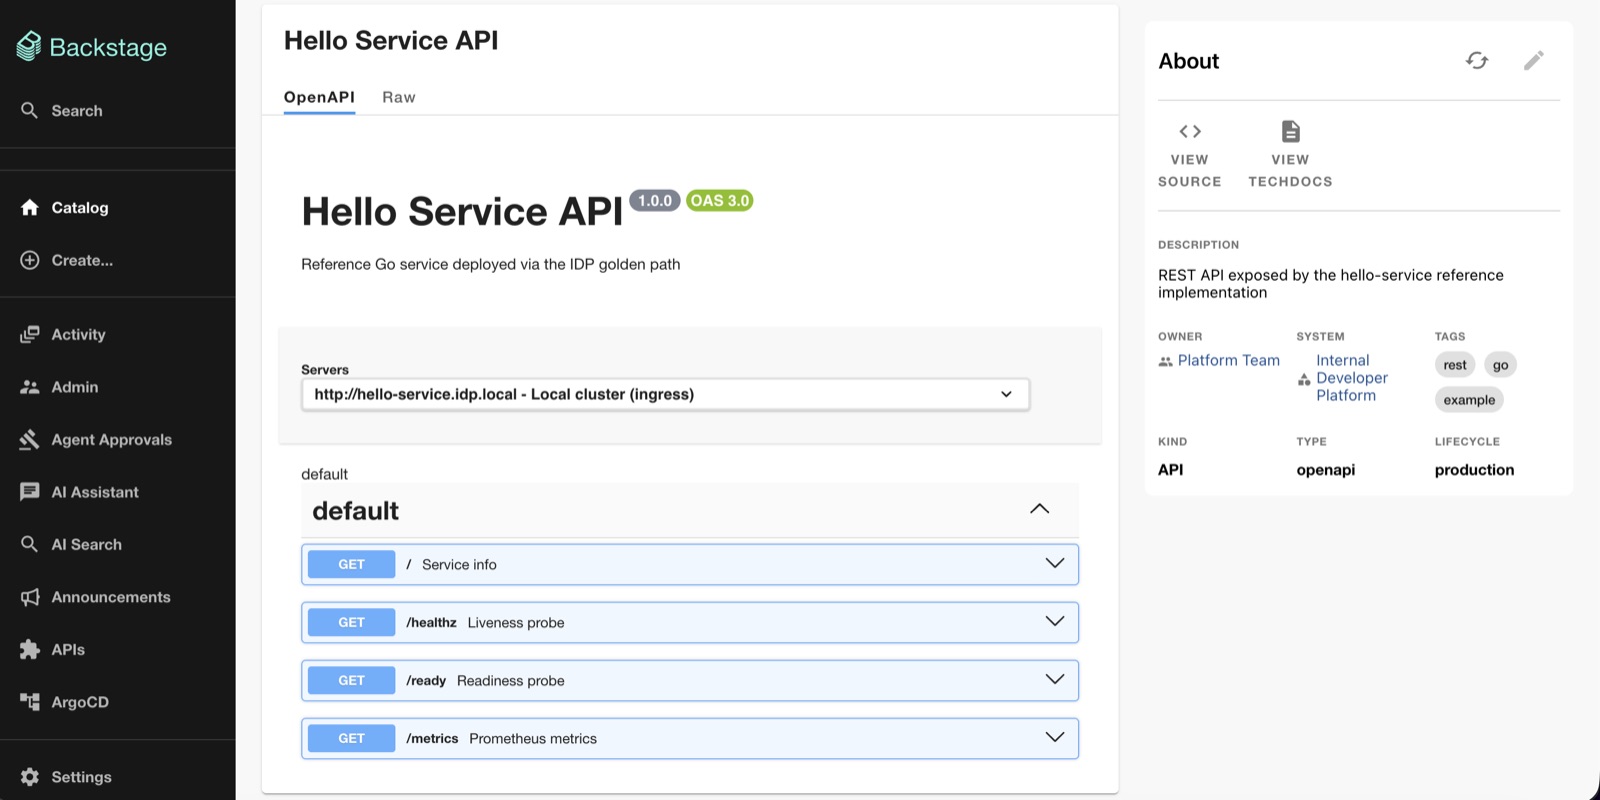
| OpenAPI spec on the entity | Onboarding |
|---|---|
 |
 |
| Learning Center | Copilot metrics |
|---|---|
 |
 |
| Admin | Activity feed |
|---|---|
 |
 |
| Search | Support |
|---|---|
 |
 |